


 FxWirePro: AUD/USD eases after Australian mixed CPI data
  Oil Prices Dip Slightly Amid Focus on Russian Sanctions and U.S. Inflation Data
  Fed May Resume Rate Hikes: BofA Analysts Outline Key Scenarios
  Gold Prices Slide as Rate Cut Prospects Diminish; Copper Gains on China Stimulus Hopes
  U.S. Treasury Yields Expected to Decline Amid Cooling Economic Pressures
  Gold Prices Fall Amid Rate Jitters; Copper Steady as China Stimulus Eyed
  FxWirePro: EUR/AUD bullish outlook with scope to target 1.6550
  U.S. Stocks vs. Bonds: Are Diverging Valuations Signaling a Shift?
  China's Refining Industry Faces Major Shakeup Amid Challenges
  FxWirePro:NZD/USD rout continues without relief
  FxWirePro: GBP/NZD gaining momentum for a move towards 2.3350level
  NZDJPY: The Kiwi Yen's Bull Run Hits a Brick Wall at 92 — Sell the Rally?
  AUDJPY Bears Take a Breather at 111.50, But ‘Sell on Rallies’ Still Eyes 110
  FxWirePro: AUD/USD drifts lower, uninspired by jobs beat
  Trump’s "Shock and Awe" Agenda: Executive Orders from Day One
  Sterling Slump Sends GBPJPY Toward 212.60 — Bearish EMA Stack Eyes 210
  FxWirePro: GBP/NZD gaining momentum for a move towards 2.3100 level


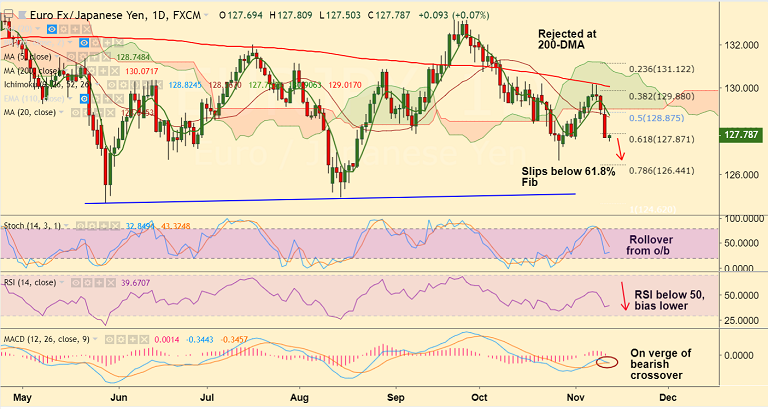
EUR/JPY chart on Trading View used for analysis
- EUR/JPY is trading 0.52% higher on the day at 128.90 at the time of writing.
- The pair has been struggling at stiff resistance in 129 to 129.23 zone, break above required for further gains.
- Price action is raging in 'Symmetric Triangle' pattern and breakout will provide clear direction.
- Technical analysis for the day shows neutral bias. RSI and Stochs are flat and inconclusive.
- Breakout above cloud base and 55-EMA could see test of 200-DMA.
- On the flipside we see strong support at 127.35 (major trendline). Break below could see weakness till 126.63 (Oct 26 low)
Support levels - 128.72 (5-DMA), 127.35 (trendline), 126.63 (Oct 26 low)
Resistance levels - 129.23 (55-EMA), 129.93 (200-DMA)
For details on FxWirePro's Currency Strength Index, visit http://www.fxwirepro.com/currencyindex.


