


 FxWirePro- Major Crypto levels and bias summary
  Nikkei Surges Past 65,000 on Suspected Yen Weakness: Tech Giants Like Advantest and NEC Lead Explosive Gains
  FxWirePro: USD/ CNY hits one-month low,scope for futher downside
  FxWirePro: GBP/NZD remains weak, eyes 38.2%fib support
  FxWirePro : GBP/NZD strongly bearish despite upside attempts
  FxWirePro: GBP/USD rises as soft US data pressures dollar
  FxWirePro: NZD/USD firms as Kiwi gains on strong ANZ business outlook data
  FxWirePro: GBP/AUD drifts lower after BOE rate decision
  EURUSD Spikes to 1.14306 on Fed Pause as Traders Eye Sell-the-Rally Setup
  JPY Action Bias: EURJPY and CADJPY Emerge as Extremely Bullish Pairs to Watch
  FxWirePro: EUR/AUD regains upwards momentum but unable to hold above 50%fib level
  FxWirePro- Major Pair levels and bias summary
  FxWirePro: NZD/USD consolidates overnight gains, but loses momentum
  FxWirePro: AUD/USD dips below lower range, bearish bias increases
  FxWirePro:USD/JPY climbs back above 160.00 after BOJ rate decision
  FxWirePro- Major Pair levels and bias summary


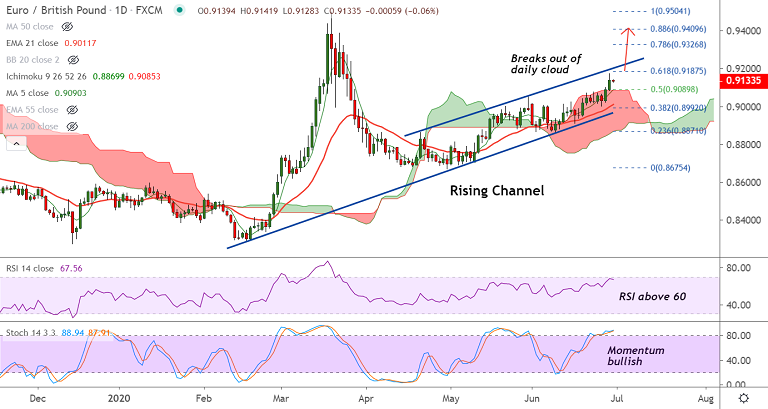
EUR/GBP chart - Trading View
Technical Analysis: Bias Bullish
GMMA Indicator
- Both major and minor trend are strongly bullish
- Scope for further upside
Ichimoku Analysis
- Price action has broken above daily cloud
- The pair holds support at Tenkan Sen
Oscillators
- Stochs and RSI are sharply higher
- Momentum strongly bullish
Bollinger Bands
- Bollinger bands are widening on the daily charts
- Volatility is high raising scope for large price swings
Summary: As the price rises in a 'Rising Channel' pattern, cloud breakout confirms further gains. Rising volatility and bullish momentum to carry prices higher. Major hurdles align at channel top at 0.92 ahead of 78.6% Fib at 0.9326.


