


 FxWirePro: EUR/AUD regains upwards momentum but unable to hold above 50%fib level
  FxWirePro: GBP/AUD drifts lower after BOE rate decision
  FxWirePro- Major Pair levels and bias summary
  Major European Indices Score Extremely Bullish: DAX Eyes 26000, CAC Targets 8600, FTSE100 at 11000 – Key Levels to Watch
  FxWirePro: NZD/USD consolidates overnight gains, but loses momentum
  FxWirePro: AUD/USD gains some ground but outlook is bearish
  FxWirePro- Major Crypto levels and bias summary
  NZDJPY Bullish Rebound: Buy Dips as EMAs Align for 97 Target
  FxWirePro:EUR/NZD gains some upside momentum but still bearish
  JPY Action Bias: EURJPY and CADJPY Emerge as Extremely Bullish Pairs to Watch
  FxWirePro: GBP/NZD remains weak, eyes 38.2%fib support
  FxWirePro: USD/JPY edges higher as focus shifts to BOJ decision
  FxWirePro- Woodies pivot (Major)
  FxWirePro: USD/CAD slips after Fed holds rates steady
  FxWirePro: GBP/USD rises as soft US data pressures dollar


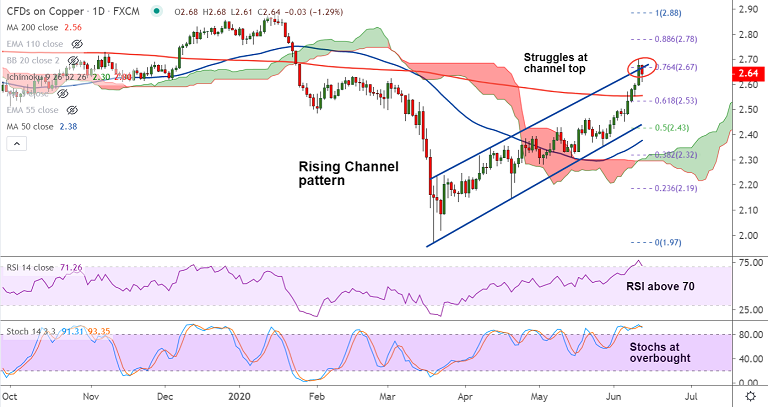
COPPER chart - Trading View
Copper was trading 1.36% lower on the day at 2.64 at around 09:47 GMT.
Price action struggles at channel top resistance, upside only on decisive break above,
The pair might see some minor pullbacks on account of overbought oscillators.
Major and minor trend have turned bullish on the daily charts after break above 200-DMA.
5-DMA is immediate support at 2.61. Break below will see test of 200-DMA at 2.56.
Pullbacks are likely to be shallow and major weakness only on retrace below 200-DMA.
Support levels - 2.61 (5-DMA), 2.56 (200-DMA), 2.53 (61.8% Fib)
Resistance levels - 2.69 (78.6% Fib), 2.73 (200W MA), 2.78 (88.6% Fib)


