


 FxWirePro: USD/CAD maintains bullish bias with focus on 1.4000
  AUDJPY: Bearish Outlook Despite Short-Term Bullish Signals, Sell Rallies Near 110.78
  FxWirePro- Woodies Pivot (Major)
  FxWirePro- Major Crypto levels and bias summary
  FxWirePro: EUR/NZD eases after hot US CPI data
  EURUSD: Bearish Trend Suggests Selling on Rallies Near 1.15670 Ahead of Fed Decision
  FxWirePro: GBP/USD gains some upside momentum but still bearish
  JPY Major Currency Score: NZDJPY, AUDJPY, GBPJPY, EURJPY Show Bearish Trend


 Add as a preferred source on Google
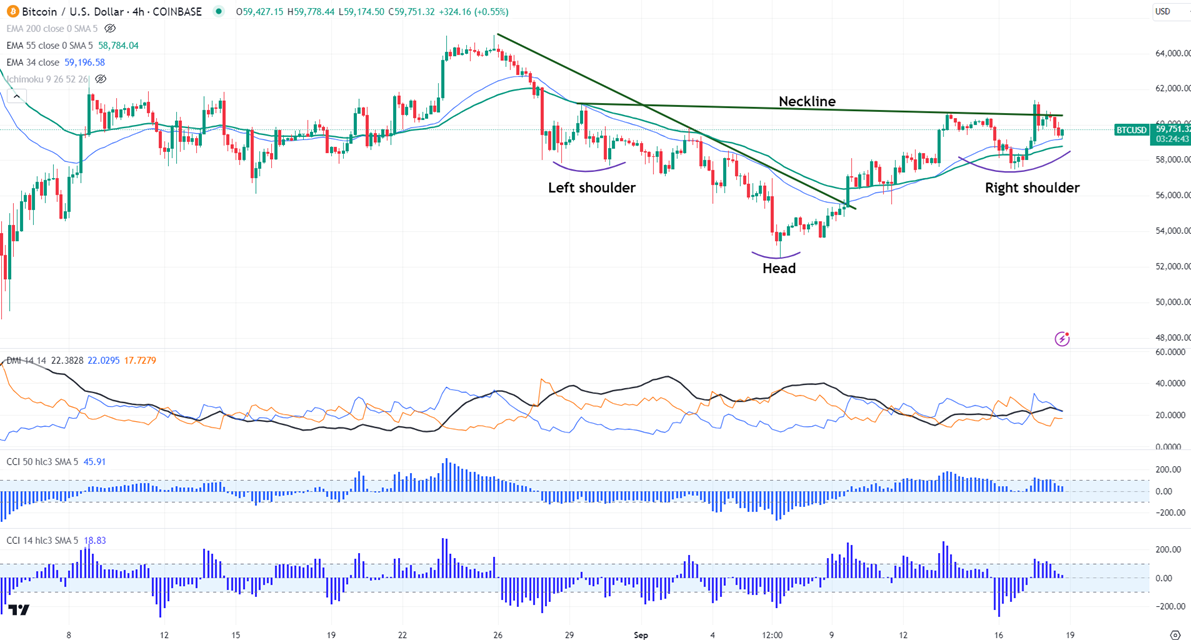
Chart pattern- Inverted Head and Shoulder
Potential reversal zone- $52530.
BTCUSD showed a minor jump above neckline and struggled to hold above that level ahead of Fed monetary policy. It hit a high of $ 61377 and is currently trading at around $58506.
According to the CME Fed watch tool, the probability of a 50 bpbs rate cut in Sep increased to 67% from 14% a week ago.
US markets -
NASDAQ (No correlation with BTC) - Bearish (neutral for BTC). The NASDAQ trades flat ahead of US Fed monetary policy. Any close above 20000 will take the index to 20500.
Technicals-
BTCUSD trades above the short-term moving average 34- EMA and below 55 EMA and below the long-term moving average (200 EMA) in the 4-hour chart.
Minor support- $57000. Any break below will take it to the next level at $55000/$52500/$50000/$46000.
Bull case-
Primary supply zone -$61800. Any break above confirms an intraday bullishness. A jump to $63000/$65000/$67000/$70000 is possible.
Secondary barrier- $70000. A close above that barrier targets $750000/$80000.
Indicator (8-hour chart)
CCI (14)- Bullish
CCI (50)- Bullish
Average directional movement Index - Neutral
It is good to buy on dips around $57500-550 with SL around $52000 for TP of $70000.







