


 FxWirePro- Major Crypto levels and bias summary
  FxWirePro- Major Crypto levels and bias summary
  Ethereum Cracks Under $1,700: Sell the Rally Near $1,750 as Bears Eye $1,380–$1,200


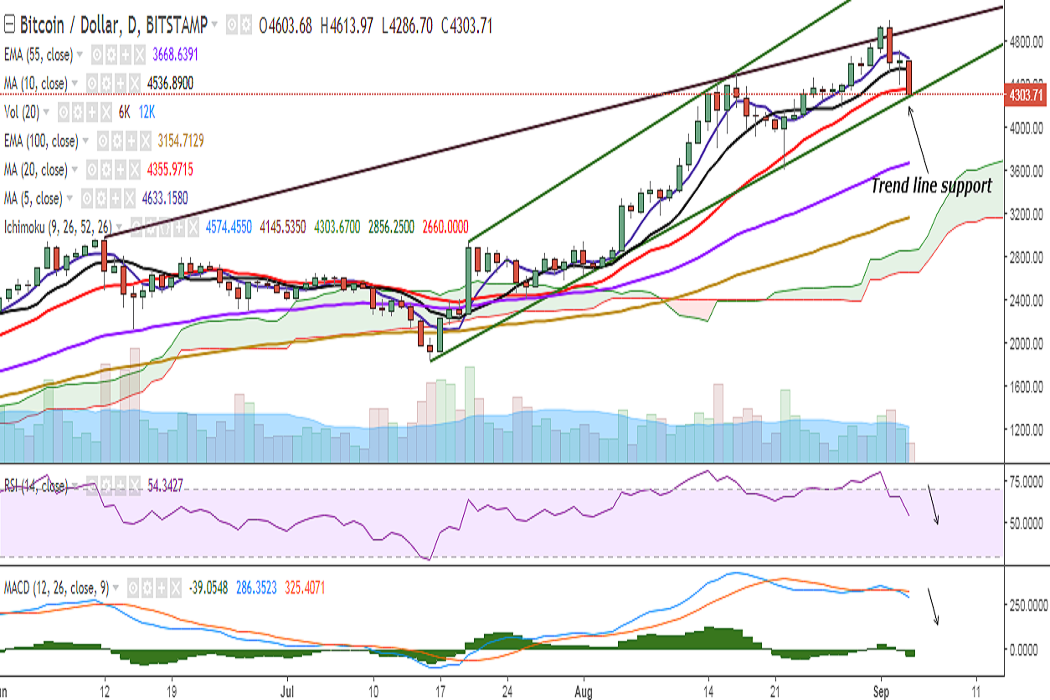
BTC/USD is trading in the red after it hit a fresh all-time high at 4979 levels on September 02. It is currently trading at 4334 levels at the time of writing (Bitstamp).
Ichimoku analysis of daily chart:
Tenkan Sen: 4574.45
Kijun Sen: 4145.53
The pair is currently hovering around 4358 (20-DMA) and a consistent upward move would target 4397 (4h 90-EMA)/4488 (4h 5-SMA). Further strength would see it testing 4542 (10-DMA)/4589 (2h 55-EMA)/4666 (2h 50-SMA)/4715 (61.6% retracement of 4979 and 4286)/4891 (trend line joining 2980 and 4480).
On the flip side, the pair has found support near 4284 (convergence of 1w 5-SMA and trend line joining 1830 and 2615) and a break below would drag it to 4236 (23.6% retracement of 1830 and 4979)/4169 (August 28 low)/4127 (61.8% retracement of 3600 and 4979)/4015 (23.6% retracement of 891.33 and 4979)/3955 (4h 200-SMA)/3870 (lower Bollinger)/3776/3600 (August 22 low).
Bias has turned bearish on the daily chart with RSI, stochs, and MACD biased lower. A close below 20-DMA would confirm further bearishness.
FxWirePro launches Absolute Return Managed Program. For more details, visit http://www.fxwirepro.com/invest

- News

- Economy

- Central Banks
- Investing
- Research
- Roundups
- Digital Currency
- Insights
- Technical Analysis
- Technology
- Business
- Law
- Health
- Nature
- Fintech
- Science
- Topic
- Opinions
- ©Econometrics LLC . All Rights Reserved.
FxWirePro: BTC/USD in the red after hitting 4979, finds trend line support at 4284, close below 20-DMA to see further downside
Monday, September 4, 2017 9:23 AM UTC
Editor's Picks


- Market Data
Most Popular


3


