


 FxWirePro- Major European Indices
  EUR/JPY Bulls Charge: Eyeing 186.00 as Euro Strength Intensifies
  FxWirePro- Major Pair levels and bias summary
  FxWirePro: GBP/USD outlook weaker on renewed downside pressure
  NZDJPY Bears Take Control: New Zealand Dollar Retreats as 92 Resistance Holds Firm
  FxWirePro: USD/JPY firms as Trump's address on Gulf war spark fresh concerns
  Bitcoin Battles Volatility: Institutional Support Eyes USD 64,000 Floor Amid Geopolitical Tensions
  Pound Under Pressure as Yen Stabilizes: GBPJPY Bears Target 208 as Key EMAs Hold Resistance
  FxWirePro: USD/CNY gains some ground but bearish outlook persists
  Euro Retreats as Geopolitical Tensions Surge: EURUSD Eyes 1.1400 Floor Amid Safe-Haven Demand
  FxWirePro: AUD/USD downside pressure builds, key support level in focus
  FxWirePro- Woodies Pivot(Major)
  Ethereum Retreats Toward USD 2,000: Technicals Signal Caution as ETH Mimics Bitcoin’s Pullback
  FxWirePro: USD/ZAR sustains gains as uptrend remains strong
  FxWirePro- Major Crypto levels and bias summary
  FxWirePro: USD/ZAR fibo rejection triggers sizeable pullback


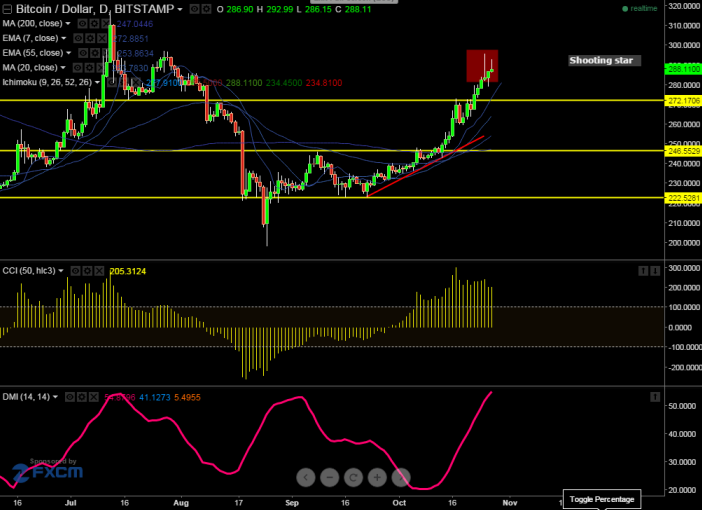
- BTC/USD has made a high of $296 and started to decline from that level. Short term trend is bearish as long as resistance $300 holds
- The pair's minor support is around $277 and any break below will drag the pair further down till $269/$258.
- On the higher side any break above $300 will take the pair till $310/$317.
Indicator (Daily chart)
CCI (50) -Buy
Ichimoku- Buy
We prefer to sell on rallies around $290-92 with SL at $300 for the TP of $277/$268.


