


 JPY Strength Alert: USDJPY, AUDJPY, EURJPY and CADJPY Turn Extremely Bullish
  FxWirePro: USD/CAD edges lower but bullish outlook persists
  BTCUSD Holds Above 365 EMA as Bullish Momentum Builds Toward $70K
  FxWirePro: EUR/AUD neutral in the near term, scope for downward resumption
  FxWirePro: EUR/ AUD downtrend loses steam, remains on bearish path
  FxWirePro: GBP/AUD downtrend loses steam but outlook still bearish
  FxWirePro:NZD/USD edges higher as kiwi firms on hawkish RBNZ outlook
  FxWirePro: AUD/USD rallies on jobs surge, heads to test key resistance
  ETHUSD Breaks Above $1900 as Bulls Eye $2300 and Beyond
  FxWirePro- Major Crypto levels and bias summary
  AUDJPY Extends Four-Day Rally as Yen Weakness Fuels Fresh Buying Opportunity
  FxWirePro: USD/CNY attracts selling interest, vulnerable to more downside
  FxWirePro- Woodies pivot (Major)


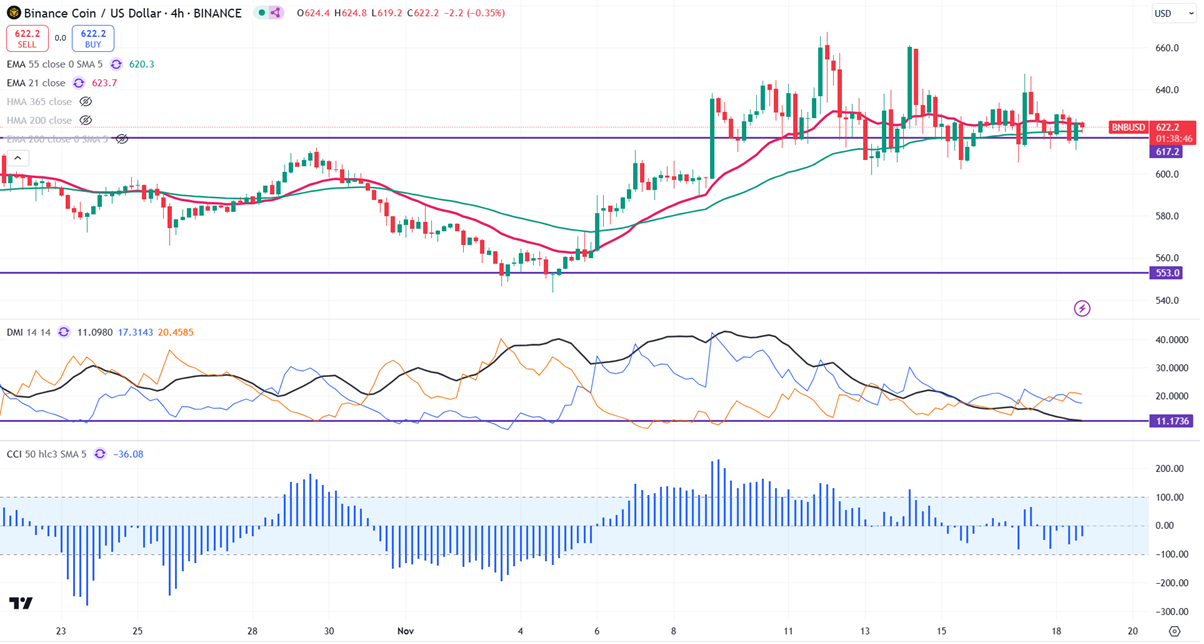
Key Level to Monitor: $545
And The BNB/USD pair has been consolidating between $667 and $599.30 for the past four days. It is currently trading around $622.40. A closing price below $585 confirms further bearishness.
Intraday bias remains bullish, with prices staying above the 34 and 55 EMA on the 4-hour chart. If the pair closes below $585, potentially leading to further declines towards $559,$545, $528, $500, and possibly down to $470.
Immediate Resistance is at $670. A successful breakout above this resistance could suggest bullish momentum, with further gains possible towards $700/$725.
Indicators (4-Hour Chart)
- Directional Movement Index: Neutral
- CCI (50): Bearish
Trading Strategy
Consider buying on dips around $600, with a stop-loss set at $550 and a target price of $700/$725.


