


 Crypto Bias Report: Trend Signals and Top Bullish Picks
  FxWirePro- Major Crypto levels and bias summary
  FxWirePro- Major Pair levels and bias summary
  FxWirePro- Woodies pivot (Major)
  EUR/USD Slides After ECB Hold, Bearish Technicals Favor Rally Fades
  FxWirePro:NZD/USD edges higher as kiwi firms on hawkish RBNZ outlook
  FxWirePro: GBP/USD slips as middle east tensions and oil surge pressure pound
  JPY Strength Alert: USDJPY, AUDJPY, EURJPY and CADJPY Turn Extremely Bullish
  FxWirePro: GBP/NZD gains some upside momentum but still bearish
  FxWirePro- Major Crypto levels and bias summary


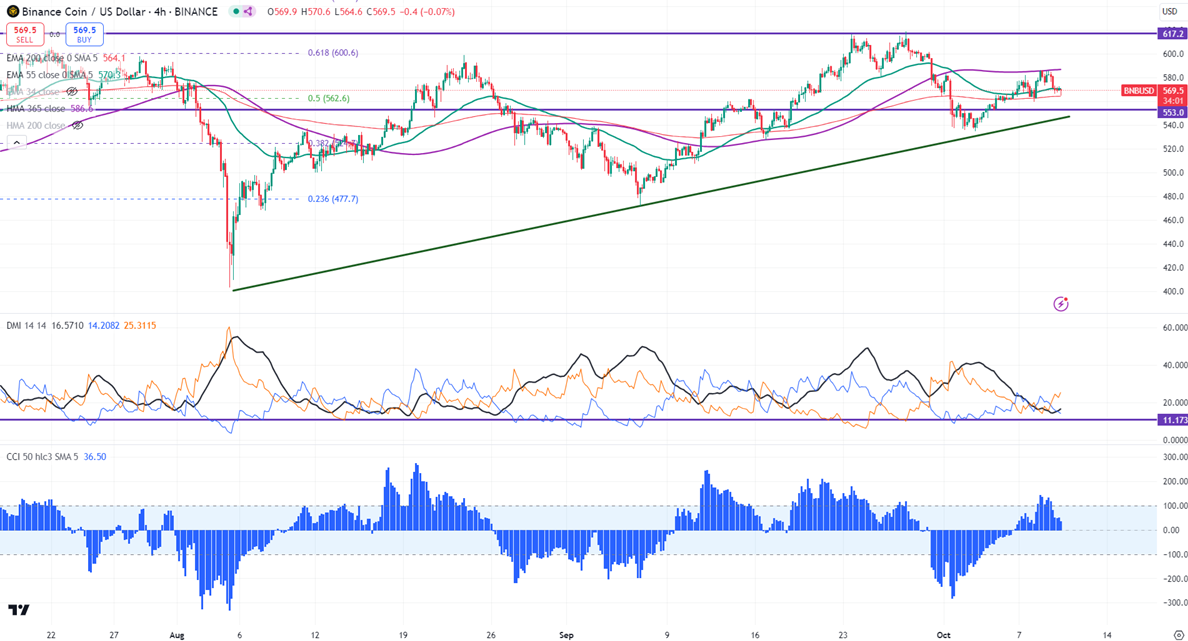
Intraday bias - Bullish
Trend reversal level- $531 (200- day EMA)
Any close above $620 confirms a bullish continuation.
BNBUSD pared some of its gains after forming a minor top around $586.30. It hits a low of $564.50 at the time of writing and is currently trading around $569.80.
The pair holds below 34 and 55 EMA in the 4-hour chart. Intraday bullishness can be seen if it breaks above 586.90 (365 Hull EMA). The bullish trend continuation can happen if the pair closes above $615 in daily chart. On the lower side, the near-term support is $560 (resistance turned into support). Any break below targets $540/$528/$500/$470 is possible.
The immediate resistance stands at around $587. Any breach above confirms minor bullishness. A jump to $605/$620/$647/$700 is possible. A surge past $725 will take it to $800.
Indicators ( 4- hour chart)
Directional movement index - bearish
CCI (50)- Bullish
It is good to buy on dips around $560 with SL around $528 for TP of $700.
a


