


 FxWirePro: NZD/USD trades in narrow range ,outlook bullish
  GBPUSD, AUDUSD & NZDUSD Turn Extremely Bullish: Strong Positive Momentum Drives Major Pair Action Bias
  FxWirePro: USD/JPY uptrend loses steam, remains on bullish path
  FxWirePro- Major Crypto levels and bias summary
  FxWirePro :USD/JPY bulls loosen their grip a bit, dips to be bought
  FxWirePro: AUD/USD edges lower, but bullish outlook persists
  FxWirePro: GBP/NZD downtrend slows, but bearish sentiment remains
  JPY Action Bias: Extremely Bullish Surge Ignites Across NZD, GBP & AUD
  FxWirePro: GBP/USD advance after softer US inflation dims Fed rate hike bets


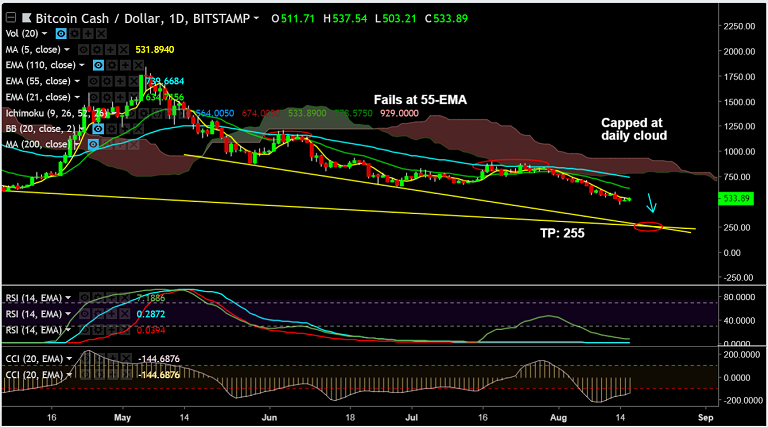
- BCH/USD hovers around 5-DMA at 531 levels, break above could see minor upside.
- The pair trades 4.02% higher on the day at 532.27at the time of writing.
- Price action has hit new lows since Nov 2017 at 471.01 before paring some losses.
- The pair which has been under consolidation since June 2018 has likely resumed downside.
- We are seeing a downward spiral for the 3rd straight week, no respite from bears yet.
- Technical indicators highly bearish and support further weakness, acute declines likely in the pair.
- Downside till 255 (major trendline support) likely. Violation there could see further weakness.
- 55-EMA caps upside and break above could see bearish invalidation with scope for reversal.
Support levels - 471 (Aug 14 low), 400 (psychological mark), 305 (Oct 2017 low), 255 (major trendline)
Resistance levels - 531 (5-DMA), 634 (21-EMA), 739 (55-EMA)
FxWirePro Currency Strength Index: FxWirePro's Hourly USD Spot Index was at 61.4331 (Neutral) at 1120 GMT. For more details on FxWirePro's Currency Strength Index, visit http://www.fxwirepro.com/currencyindex.


