


 FxWirePro- Woodies pivot (Major)
  FxWirePro: AUD/USD falls after softer-than-expected Australian Q2 CPI
  FxWirePro: USD/CAD runs out of steam but maintains bullish outlook
  FxWirePro: GBP/AUD gains some upside momentum but still bearish
  FxWirePro: EUR/ AUD gains some ground , but remains on bearish path
  JPY Pairs Action Bias: EURJPY Leads as Bullish Standout Amid Mixed Momentum
  FxWirePro: EUR/AUD regains upwards momentum but unable to hold above 50%fib level
  EURUSD Spikes to 1.14306 on Fed Pause as Traders Eye Sell-the-Rally Setup
  FxWirePro: GBP/NZD maintains bersish bias with focus on 2.2900 level
  FxWirePro: USD/ZAR firms ahead of Fed interest rate decision
  FxWirePro: USD/CAD slips after Fed holds rates steady
  FxWirePro- Woodies pivot (Major)
  FxWirePro: NZD/USD neutral in the near-term, scope for downward resumption
  FxWirePro: USD/JPY eases ahead of Fed decision , Intervention risks linger
  FxWirePro: GBP/AUD gains above 1.9200 level , upside pressure builds


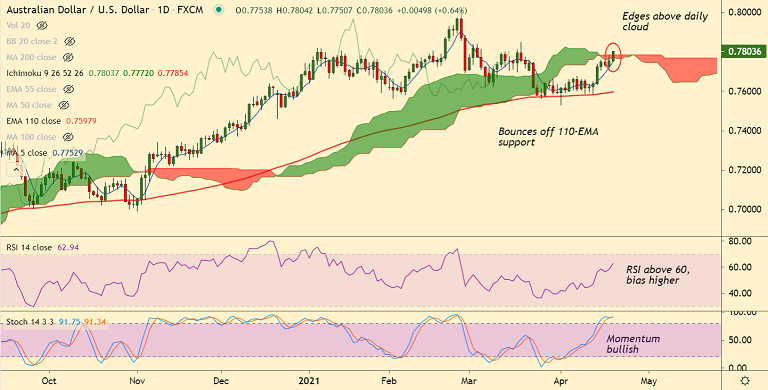
AUD/USD chart - Trading View
Spot Analysis:
AUD/USD was trading 0.51% higher on the day at 0.7793 at around 05:50 GMT.
Previous session's High/Low:
Previous week's High/Low:
Technical Analysis: Bias Bullish
- Volatility is high and rising as evidenced by widening Bollinger bands
- GMMA indicator show short-term moving averages are strongly bullish
- Price action has edged above daily cloud, Chikou span is biased higher
- Momentum is bullish, Stochs and RSI are sharply higher
- MACD and ADX also support upside in the pair
Major Support and Resistance Levels:
Support levels - 0.7751 (5-DMA), 0.7691 (21-EMA), 0.7681 (55-EMA)
Resistance levels - 0.78 (Psychological mark), 0.7846 (Upper W BB), 0.79
Summary: Technical bias for the pair is bullish. Price action is on verge of break above stiff resistance at 110-month EMA. Scope for test of 0.7850 levels. Major bull target lies at 200-month MA at 0.8259.


