


 FxWirePro: EUR/ AUD dips below 1.6400 level, focus on near term support
  FxWirePro: NZD/USD consolidates overnight gains, but loses momentum
  FxWirePro- Major Pair levels and bias summary
  FxWirePro: USD/ZAR gains as stronger dollar outweighs upbeat South Africa's trade surplus
  FxWirePro: USD/CNY dips to hit three year low,scope for further downside
  FxWirePro: USD/CNY downtrend loses steam, remains on bearish path
  FxWirePro: GBP/USD rises as soft US data pressures dollar
  Major European Indices Score Extremely Bullish: DAX Eyes 26000, CAC Targets 8600, FTSE100 at 11000 – Key Levels to Watch
  All Major JPY Pairs Hit Extreme Bearish Score of -100: USDJPY, EURJPY, GBPJPY, AUDJPY, NZDJPY & CADJPY Flash Maximum Weakness
  FxWirePro- Major Crypto levels and bias summary
  FxWirePro:USD/JPY climbs back above 160.00 after BOJ rate decision
  FxWirePro- Major Crypto levels and bias summary
  AUDJPY Volatile After Massive Sell-Off: Sell Rallies at 113, Targeting 110 as Bearish Momentum Surges
  NZDJPY Retreats on Yen Strength – Bearish Setup Targets 90 After Hitting 92.75 Low
  FxWirePro: GBP/AUD drifts lower after BOE rate decision


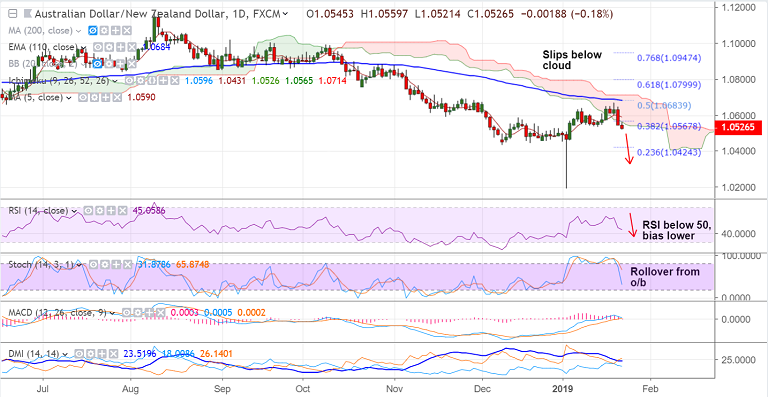
AUD/NZD chart on Trading View used for analysis
- AUD/NZD trades 0.19% lower on the day at 1.0525 at 0550 GMT, bias lower.
- The pair is extending weakness for the 2nd straight session after failure to take out 110-EMA resistance.
- The bird buoyed after New Zealand inflation numbers surprised to the upside. Q4 2018 CPI rises +1.9% y/y, beating expectations at 1.8%.
- However, the beat was marginal and it is unlikely to shift the status quo at the RBNZ.
- AUD/NZD upside capped at 21-EMA, slips below daily cloud, scope for further weakness.
- Technical studies are bearish. RSI below 50, bias lower, Stochs show rollover from overbought levels.
Support levels - 1.0451 (Lower BB), 1.0424 (23.6% Fib)
Resistance levels - 1.0565 (nearly converged 21-EMA and cloud base), 1.06
Recommendation: Good to stay short on upticks, SL: 1.06, TP: 1.0450/ 1.0425
For details on FxWirePro's Currency Strength Index, visit http://www.fxwirepro.com/currencyindex.


