


 NZDJPY Retreats on Yen Strength – Bearish Setup Targets 90 After Hitting 92.75 Low
  FxWirePro: GBP/NZD remains weak, eyes 38.2%fib support
  Major European Indices Score Extremely Bullish: DAX Eyes 26000, CAC Targets 8600, FTSE100 at 11000 – Key Levels to Watch
  FxWirePro- Major Pair levels and bias summary
  FxWirePro: USD/CNY dips to hit three year low,scope for further downside
  FxWirePro:EUR/NZD gains some upside momentum but still bearish
  JPY Action Bias: EURJPY and CADJPY Emerge as Extremely Bullish Pairs to Watch
  FxWirePro: NZD/USD consolidates overnight gains, but loses momentum
  FxWirePro: AUD/USD gains some ground but outlook is bearish
  FxWirePro: USD/CAD slips after Fed holds rates steady
  FxWirePro: USD/ CNY hits one-month low,scope for futher downside
  AUDJPY Volatile After Massive Sell-Off: Sell Rallies at 113, Targeting 110 as Bearish Momentum Surges
  JPY Currency Meter Signals: NZDJPY Bullish (+25) vs CHFJPY (-100) – These Pairs Could Move Next
  FxWirePro: GBP/AUD drifts lower after BOE rate decision
  FxWirePro : GBP/NZD strongly bearish despite upside attempts
  FxWirePro- Major Crypto levels and bias summary
  FxWirePro: GBP/USD rises as soft US data pressures dollar


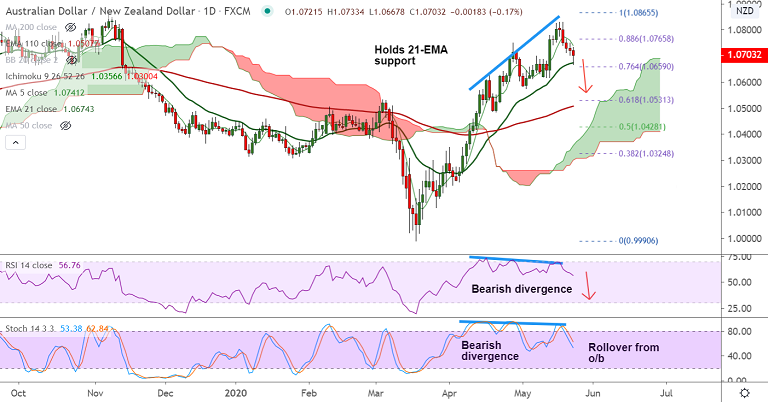
AUD/NZD chart - Trading View
AUD/NZD was trading 0.17% lower on the day at 1.0702 at around 10:55 GMT.
The pair is extending weakness for the 5th straight session, technical indicators have turned bearish.
Aussie under pressure after Fitch downgraded Australia’s outlook to negative while keeping its AAA rating.
'Bearish divergence' on RSI and Stochs add to downside pressure. Stochs and RSI are biased lower.
Price action is pivotal at 21-EMA support at 1.0674. The pair is trading below 200H MA.
Break below 21-EMA could drag prices lower. Next major support lies at 55-EMA at 1.0555 ahead of 200-DMA at 1.0535.
Major trend in the pair is still bullish as evidenced by GMMA indicator. Bounce of 21-EMA will see upside resumption.
Support levels - 1.0674 (21-EMA), 1.0555 (55-EMA), 1.0535 (200-DMA)
Resistance levels - 1.0741 (5-DMA), 1.0748 (200H MA), 1.0865 (Nov 2019 high)


