


 FxWirePro: EUR/AUD dips below 1.6200 level ,vulnerable to more downside
  FxWirePro- Woodies Pivot (Major)
  FxWirePro: USD/CAD maintains bullish bias with focus on 1.4000
  FxWirePro: EUR/AUD scales one-week peak after ECB rate hike
  JPY Major Currency Score: All Bearish
  FxWirePro: EUR/NZD eases after hot US CPI data
  Bitcoin Consolidates Near $78K: Will Strong ETF Inflows Trigger a Breakout to $90K?
  FxWirePro: GBP/NZD runs out of steam but maintains bullish outlook
  FxWirePro- Major Crypto levels and bias summary
  FxWirePro: USD/CNY sees some bounce after yesterday's fall
  EURUSD Holds Above 1.1600 Despite US CPI, Fed Rate Hike on the Horizon


 Add as a preferred source on Google
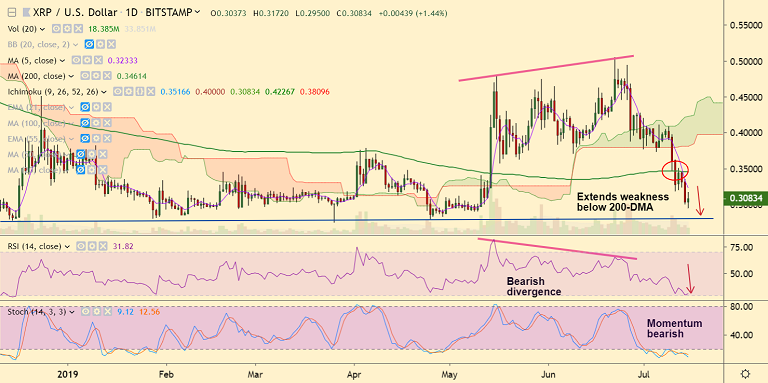
XRP/USD chart - Trading View
Exchange - Bitstamp
Support: 0.28 (Trendline); Resistance: 0.3231 (5-DMA)
Technical Analysis: Bias Bearish
XRP/USD is extending weakness below 200-DMA, bias is bearish.
The pair has hit new 2-month lows at 0.2950, scope for further downside.
Momentum studies are highly bearish and bearish divergence on RSI and Stochs likely to plummet prices further.
GMMA indicator shows shift in trend with shorter-term moving averages slipping below longer-term moving averages.
The pair has closed below 20W SMA and volatility is rising. Next major support lies at 0.28 (trendline).
Break below will see dip till lower Bollinger band (weekly) at 0.2441. Retrace above 200-DMA to see minor upside.
For details on FxWirePro's Currency Strength Index, visit http://www.fxwirepro.com/currencyindex.







