


 FxWirePro- Major Crypto levels and bias summary
  FxWirePro- Major Crypto levels and bias summary
  FxWirePro: EUR/NZD eases after hot US CPI data
  FxWirePro: EUR/NZD gaining momentum for a move towards 2.0100 level
  FxWirePro: EUR/AUD scales one-week peak after ECB rate hike
  Upbeat UK GDP Fails to Lift GBP/JPY as Bears Target 207
  Major Currency Pair Scores: USD/CHF Signals Strong Bullish Momentum as NZD/USD Turns Heavily Bearish
  NZDJPY Consolidates, Resistance at 90.78 May Signal Favorability for Downtrend
  FxWirePro: USD/JPY slips as yen firms after hot Japan's wholesale inflation data


 Add as a preferred source on Google
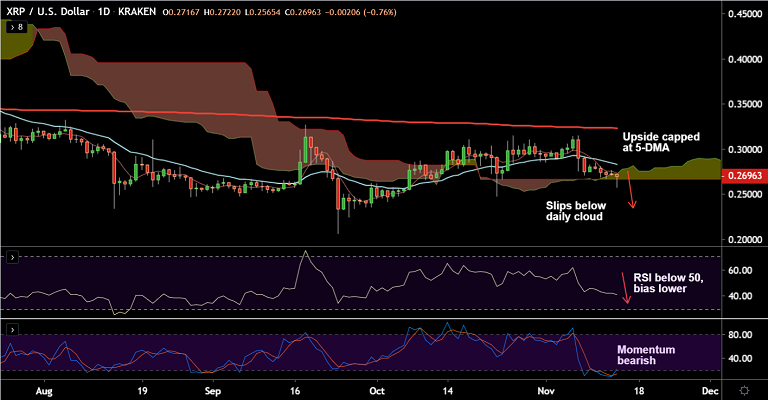
XRP/USD chart - Trading View
Exchange - Kraken
Support: 0.2472 (Oct 21 low); Resistance: 0.2750 (100-DMA)
Technical Analysis: Bias Bearish
XRP/USD is extending weakness for the 3rd straight week, bias strongly bearish.
The pair slipped below daily cloud to hit fresh 3-week lows at 0.2565 before paring some losses to trade at 0.2686 at 05:55 GMT.
Technical indicators have turned bearish. Stochs and RSI are sharply lower and RSI is well below 50 mark.
MACD is biased lower and ADX supports weakness along with -ve DMI dominance.
Supports on the downside are seen at 0.2472 (Oct 21 low) ahead of lower weekly Bollinger band at 0.2210.
5-DMA is immediate resistance at 0.2731, break above will see gains till 55-EMA at 0.2828.







