


 FxWirePro: GBP/USD advance after softer US inflation dims Fed rate hike bets
  FxWirePro- Major Crypto levels and bias summary
  FxWirePro: GBP/NZD downtrend slows, but bearish sentiment remains
  NZDJPY Extremely Bullish Above 94: Broad NZD Buying Fuels Fresh Upside – Buy Dips at 93.70 Targeting 95
  FxWirePro: USD/CAD falls after BoC rate hold and weak U.S. producer inflation
  FxWirePro: GBP/NZD gains some upside momentum but still bearish
  FxWirePro:EUR/NZD extends fall, key support lies ahead


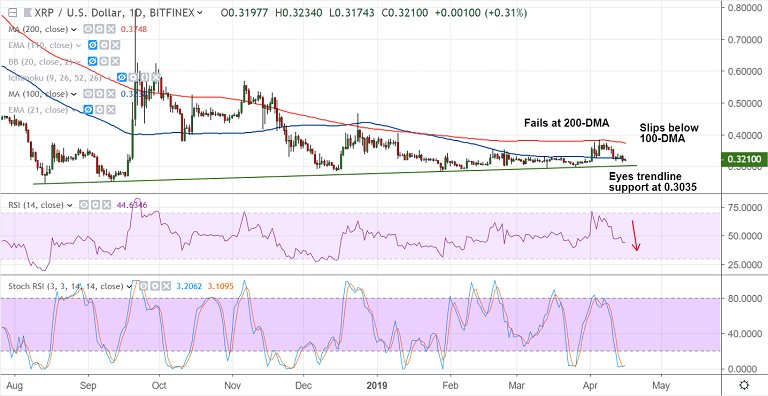
XRP/USD chart - Trading View
Exchange - Bifinex
Support: 0.3040 (trendline); Resistance: 0.3238 (100-DMA)
Technical Analysis: Bias Bearish
- XRP/USD fails at 200-DMA, slips below 100-DMA
- Price has fallen below major EMAs on the daily chart
- Stochs and RSI are sharply lower and RSI is below 50 mark
- Recovery lacks traction, upside capped at 100-DMA
- Scope for test of strong trendline support at 0.3035
For details on FxWirePro's Currency Strength Index, visit http://www.fxwirepro.com/currencyindex.

- News

- Economy

- Central Banks
- Investing
- Research
- Roundups
- Digital Currency
- Insights
- Technical Analysis
- Technology
- Business
- Law
- Health
- Nature
- Fintech
- Science
- Topic
- Opinions
- ©Econometrics LLC . All Rights Reserved.
Crypto Technicals: XRP/USD capped below 100-DMA, dip till 0.3040 likely
Tuesday, April 16, 2019 1:32 PM UTC
Editor's Picks


- Market Data
Most Popular


