


 AUDJPY Extremely Bullish Above 113: Strong AUD Fuels Fresh Rally – Buy Dips at 113 Targeting 115
  BTCUSD Bullish Breakout: Clears 800-EMA After Consolidation, Buy Dips Toward $74,900
  FxWirePro: AUD/USD edges lower, but bullish outlook persists
  Crypto Major Pair Action Bias: ETHUSD Bullish as BTCUSD, SOLUSD & XRPUSD Stay Neutral
  FxWirePro- Major Crypto levels and bias summary
  GBPUSD, AUDUSD & NZDUSD Turn Extremely Bullish: Strong Positive Momentum Drives Major Pair Action Bias
  FxWirePro- Major Crypto levels and bias summary


 to open up short-term downside - EconoTimes)


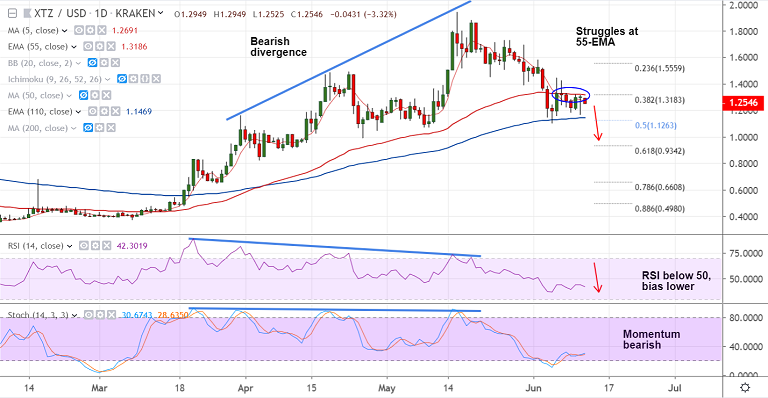
XTZ/USD chart - Trading View
Exchange - Kraken
Support: 1.1470 (110-EMA); Resistance: 1.3187 (55-EMA)
Technical Analysis: Bias Slightly Bearish
XTZ/USD pauses 3 straight weeks of losses, is extending sideways grind.
The pair is struggling to extend recovery, finds stiff resistance at 55-EMA (1.3187).
Technical studies support downside. MACD and DMI show further weakness.
Stochs and RSI are sharply lower and 'Bearish Divergence' on RSI and Stochs adds to the bearish bias.
'Hammer' at lows hampers downside, signals buying pressure at lows. Break below 110-EMA (1.1470) opens up short-term downside.
Next bear target lies at 61.8% Fib at 0.9342. Retrace above 55-EMA to negate near-term bearishness.
For details on FxWirePro's Currency Strength Index, visit http://www.fxwirepro.com/currencyindex.


