


 FxWirePro: USD/CAD falls after BoC rate hold and weak U.S. producer inflation
  GBPJPY Bullish on Consolidation: Holds Above 216 After 218 Top – Buy Dips at 217 Targeting 220
  NZDJPY Extremely Bullish Above 94: Broad NZD Buying Fuels Fresh Upside – Buy Dips at 93.70 Targeting 95
  FxWirePro- Major Crypto levels and bias summary
  FxWirePro: NZD/USD trades in narrow range ,outlook bullish
  FxWirePro: GBP/NZD downtrend slows, but bearish sentiment remains
  Crypto Major Pair Action Bias: ETHUSD Bullish as BTCUSD, SOLUSD & XRPUSD Stay Neutral
  AUDJPY Extremely Bullish Above 113: Strong AUD Fuels Fresh Rally – Buy Dips at 113 Targeting 115


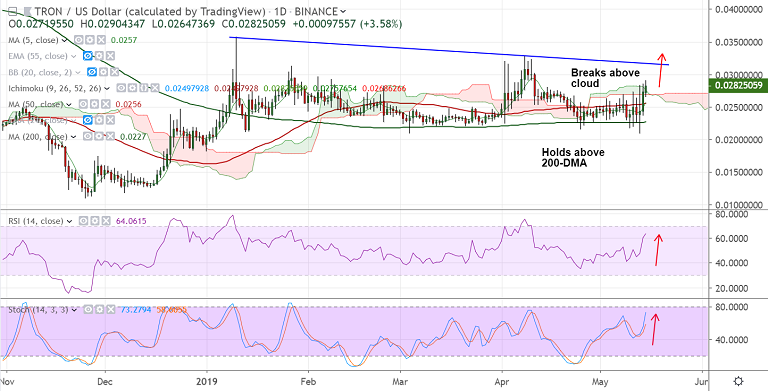
TRX/USD chart - Trading View
Exchange - Binance
Support: 0.0256 (50-DMA); Resistance: 0.0315 (trendline)
Technical Analysis: Bias Bullish
TRON has broken out of consolidation phase, could build upside momentum
TRX/USD trade had been capped between 200 and 50 day moving averages
Price action has now broken above 50-DMA and has edged above daily cloud
Volatility is rising as indicated by widening Bollinger Bands, Stochs and RSI are sharply higher
Scope for upside till 0.0315 (trendline resistance) and then 0.0327 (Apr 8th high)
Failure at daily cloud will see retrace till 50-DMA at 0.0256. Break below 200-DMA to see major downside
For details on FxWirePro's Currency Strength Index, visit http://www.fxwirepro.com/currencyindex.


