


 FxWirePro: EUR/AUD scales one-week peak after ECB rate hike
  FxWirePro: EUR/NZD eases after hot US CPI data
  Bitcoin Consolidates Near $78K: Will Strong ETF Inflows Trigger a Breakout to $90K?
  Upbeat UK GDP Fails to Lift GBP/JPY as Bears Target 207
  FxWirePro- Woodies Pivot (Major)
  FxWirePro: GBP/NZD gains some upside momentum but still bearish
  FxWirePro: USD/CNY sees some bounce after yesterday's fall


 recovery attempts lack traction, slips below 50-DMA - EconoTimes)


 Add as a preferred source on Google
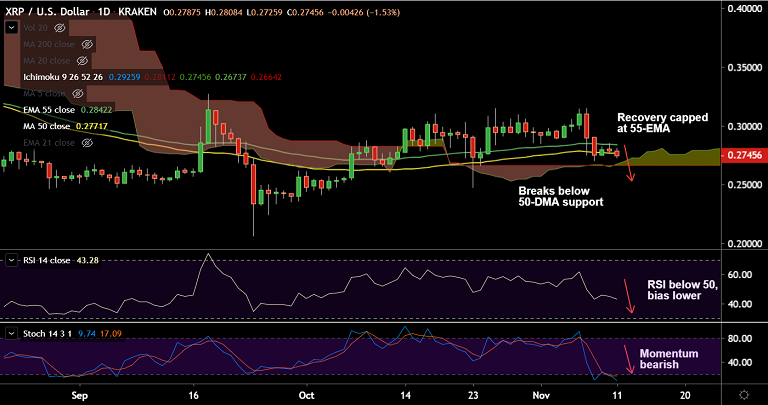
BTC/USD chart - Trading View
Exchange - Kraken
Support: 0.2673 (Daily cloud); Resistance: 0.2842 (55-EMA)
Technical Analysis: Bias Bearish
XRP/USD was trading at 0.2745, down 1.53% at 07:30 GMT after closing 0.49% lower in the previous session.
Intraday bias for the pair is strongly bearish, minor recovery attempts capped at 55-EMA.
Technical bias for the pair on the daily charts as shown by GMMA has shifted to bearish. Scope for further downside.
Stochs and RSI are now sharply lower, RSI has slipped below 50 mark. MACD and ADX also support weakness.
Price action has slipped below 50-DMA and 100-DMAs, is on track to test daily cloud at 0.2673.
Break below cloud will accentuate weakness. Volatility is rising and break below cloud will see dip till 0.2472 (Oct 23 low).







