


 GBPJPY Bullish on Consolidation: Holds Above 216 After 218 Top – Buy Dips at 217 Targeting 220
  FxWirePro- Major Crypto levels and bias summary
  ETH Stands Alone Bullish; BTC, SOL, XRP, BNB Neutral
  ETHUSD Bullish Momentum: Follows BTC Above All EMAs, Buy Dips Near $1750 Targeting $2300
  FxWirePro: USD/CAD falls after BoC rate hold and weak U.S. producer inflation
  FxWirePro- Major Crypto levels and bias summary
  FxWirePro: AUD/USD remains buoyant, looks to extend gains
  FxWirePro- Woodies pivot (Major)
  FxWirePro :USD/JPY bulls loosen their grip a bit, dips to be bought
  GBPUSD, AUDUSD & NZDUSD Turn Extremely Bullish: Strong Positive Momentum Drives Major Pair Action Bias


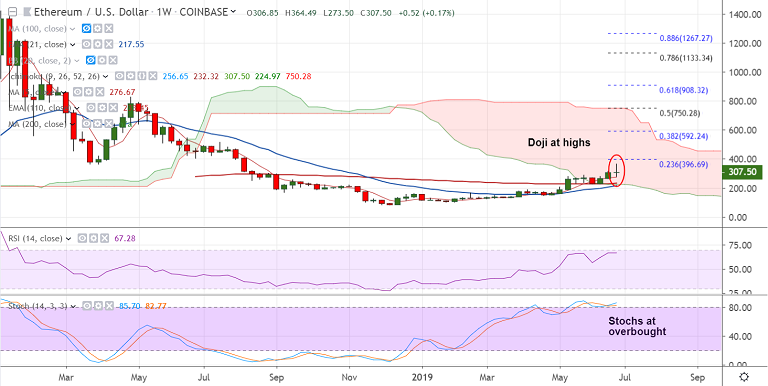
ETH/USD chart - Trading View
Exchange - Coinbase
Support: 279.89 (20-DMA) ; Resistance: 312.60 (5-DMA)
Technical Analysis: Major trend - Bullish; Minor trend - Turning Slightly Bearish
ETH/USD was trading 4.65% higher on the day at 307.60 at 10:00 GMT.
The pair edges higher from weekly lows at 273.50, finds strong support at 20-DMA.
Major trend in the pair is bullish. GMMA has shown a shift in trend to bullish on the daily charts.
On the daily charts, oscillators have approached overbought levels and are on verge of rollover into neutral territory.
Price action has broken below 5-DMA and Stochastics RSI is showing rollover from overbought levels.
A potential 'Shooting Star' formation on the weekly charts raises scope for weakness.
Further, bearish divergence on RSI and Stochs on the daily charts adds to the bearish bias.
The pair finds strong support at 20-DMA at 280, break below will see weakness till 55-EMA at 252
For details on FxWirePro's Currency Strength Index, visit http://www.fxwirepro.com/currencyindex.


