


 BTCUSD Bullish Breakout: Clears 800-EMA After Consolidation, Buy Dips Toward $74,900
  FxWirePro- Major Crypto levels and bias summary
  FxWirePro: AUD/USD edges lower, but bullish outlook persists
  FxWirePro:EUR/NZD extends fall, key support lies ahead
  FxWirePro: USD/CAD falls after BoC rate hold and weak U.S. producer inflation
  EUR/USD Holds Bullish Tone Despite Pullback from Yesterday’s High
  FxWirePro: EUR/AUD bears maintain upper hand
  FxWirePro- Major Crypto levels and bias summary
  FxWirePro: GBP/USD hits one-month high, scope for further upside
  Major JPY Action Bias — Extremely Bullish Setups in NZD/JPY, AUD/JPY and CAD/JPY
  Major Pair Action Bias: Extremely Bullish Surge Powers GBPUSD & NZDUSD as Bullish Momentum Ignites
  AUDJPY Extremely Bullish Above 113: Strong AUD Fuels Fresh Rally – Buy Dips at 113 Targeting 115


 - EconoTimes)


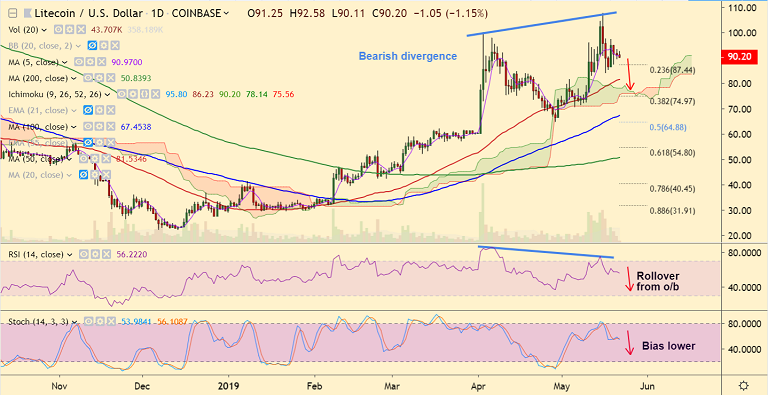
LTC/USD chart - Trading View
Exchange - Coinbase
Support: 86 (21-EMA); Resistance: 98
Technical Analysis: Bias Slightly Bearish
LTC/USD is extending weakness for the 3rd straight session, bias lower.
The pair is trading below 5-DMA which is now showing a turn Southwards.
Price has also formed a bearish divergence on RSI on the daily charts.
Major trend is definitely bullish, a correction till 21-EMA likely.
Further weakness will see test of 50-DMA at 81.53. Bullish invalidation only below 200-DMA.
Bulls have been struggling to get past $98 mark. Breakout there could see resumption of upside.
For details on FxWirePro's Currency Strength Index, visit http://www.fxwirepro.com/currencyindex.


