


 FxWirePro: GBP/NZD gains some upside momentum but still bearish
  FxWirePro: GBP/NZD runs out of steam but maintains bullish outlook
  EURUSD Holds Above 1.1600 Despite US CPI, Fed Rate Hike on the Horizon
  FxWirePro: GBP/AUD struggle to extend its recovery, good to sell on rally
  FxWirePro: EUR/NZD eases after hot US CPI data
  JPY Major Currency Score: All Bearish
  EUR/USD Defies ECB Rate Hike to Reclaim 1.1600: Technical Setup Points to Buy-on-Dips Opportunity
  FxWirePro: GBP/USD gains some upside momentum but still bearish
  FxWirePro: USD/JPY slips as yen firms after hot Japan's wholesale inflation data
  FxWirePro- Major Crypto levels and bias summary
  FxWirePro- Major Crypto levels and bias summary
  NZDJPY Consolidates, Resistance at 90.78 May Signal Favorability for Downtrend
  FxWirePro- Major Crypto levels and bias summary


 Add as a preferred source on Google
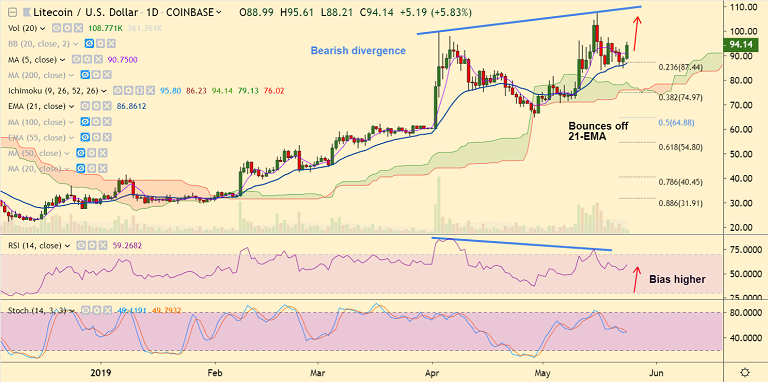
LTC/USD chart - Trading View
Exchange - Coinbase
Support: 87.01 (21-EMA); Resistance: 98
Technical Analysis: Bias Bullish
LTC/USD is extending gains for the 2nd straight session, bias higher.
The pair was trading 7.69% higher on the day at 95.73 at 08:25 GMT.
Pullback in the pair has held support at 21-EMA. Weakness only on break below.
The pair has edged above 5-DMA and RSI is now showing a turn higher.
Major trend is definitely bullish, a bearish divergence on RSI on the daily charts could cap upside.
Bulls have been struggling to get past $98 mark. Breakout there could see test of $109 level.
Break below 21-EMA will see test of 50-DMA at 81.75. Bullish invalidation only below 200-DMA.
For details on FxWirePro's Currency Strength Index, visit http://www.fxwirepro.com/currencyindex.







