


 EURUSD Holds Above 1.1600 Despite US CPI, Fed Rate Hike on the Horizon
  Upbeat UK GDP Fails to Lift GBP/JPY as Bears Target 207
  EUR/USD Defies ECB Rate Hike to Reclaim 1.1600: Technical Setup Points to Buy-on-Dips Opportunity
  NZDJPY Consolidates, Resistance at 90.78 May Signal Favorability for Downtrend
  FxWirePro: AUD/USD stays defensive ahead of key U.S. inflation data
  FxWirePro: EUR/AUD dips below 1.6200 level ,vulnerable to more downside
  Bitcoin Consolidates Near $78K: Will Strong ETF Inflows Trigger a Breakout to $90K?


 Add as a preferred source on Google
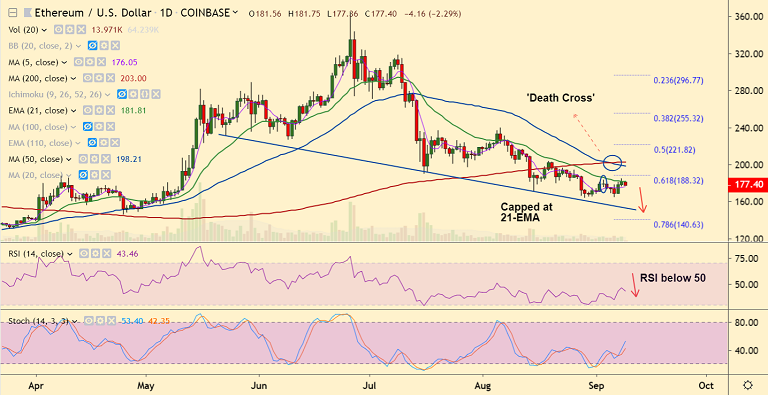
ETH/USD chart - Trading View
Exchange - Coinbase
Support: 176.14 (5-DMA); Resistance: 198.21 (50-DMA)
Technical Analysis: Bias Bearish
ETH/USD fails at 21-EMA resistance, trades 2.04% lower at 177.86 at 06:35 GMT.
'Death Cross' (bearish 50-DMA crossover on 200-DMA) keeps downside pressure.
The pair has broken below 55H EMA and is on track to test 200H SMA at 175.48.
Technical indicators are biased lower. Major trend in the pair is bearish according to GMMA indicator.
5-DMA is immediate support. Break below will see weakness till 153.50 (trendline).
On the flipside, 'bullish divergence' on RSI and Stochs on the daily charts raises scope for upside.
Break above 21-EMA (181.85) could see further gains. Next major resistance lies at 50-DMA at 198.21.







