


 FxWirePro: GBP/NZD runs out of steam but maintains bullish outlook
  FxWirePro: USD/JPY slips as yen firms after hot Japan's wholesale inflation data
  Upbeat UK GDP Fails to Lift GBP/JPY as Bears Target 207
  Gold Loses Luster Amid Rising US Bond Yields, Iran Conflict; Sell on Rallies Advised
  Bitcoin Consolidates Near $78K: Will Strong ETF Inflows Trigger a Breakout to $90K?
  FxWirePro- Major Crypto levels and bias summary
  FxWirePro: USD/CAD firms slightly, but downward resumption looks likely
  FxWirePro: EUR/AUD dips below 1.6200 level ,vulnerable to more downside
  Major Currency Pair Scores: USD/CHF Signals Strong Bullish Momentum as NZD/USD Turns Heavily Bearish
  FxWirePro- Major Crypto levels and bias summary
  FxWirePro- Major Pair levels and bias summary


 Add as a preferred source on Google
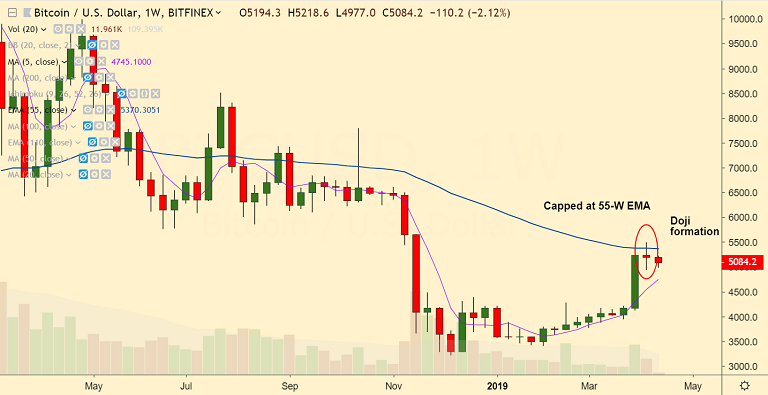
BTC/USD chart - Trading View
Exchange - Bitfinex
Resistance: 5370 (55W EMA); Support: 4617 (200-DMA)
Technical Analysis: Bias Slightly Bearish
- BTC/USD struggling to hold above 5000 mark
- Doji formation on previous week's candle raises scope for downside
- Stochs and RSI on the daily charts have rolled over from overbought levels
- MACD is on verge of a bearish crossover on signal line
- Recovery on daily charts capped at 5-DMA, decisive break above could see some upside
- Rejection at 5-DMA will see dip till 4871 (21-EMA). Further weakness eyes 200-DMA at 4617
For details on FxWirePro's Currency Strength Index, visit http://www.fxwirepro.com/currencyindex.

- News

- Economy

- Central Banks
- Investing
- Research
- Roundups
- Digital Currency
- Insights
- Technical Analysis
- Technology
- Business
- Law
- Health
- Nature
- Fintech
- Science
- Topic
- Opinions
- ©Econometrics LLC . All Rights Reserved.
Crypto Technicals: Bitcoin retraces from multi-week highs, Doji on weekly candle raises scope for downside
Tuesday, April 16, 2019 11:31 AM UTC
Editor's Picks



- Market Data
Most Popular




