


 FxWirePro- Major Crypto levels and bias summary
  FxWirePro: USD/CNY sees some bounce after yesterday's fall
  JPY Major Currency Score: All Bearish
  FxWirePro- Major Pair levels and bias summary
  FxWirePro: USD/JPY slips as yen firms after hot Japan's wholesale inflation data
  FxWirePro: AUD/USD stays defensive ahead of key U.S. inflation data
  AUDJPY Trades in Narrow Range, Bearish Indicators Suggest Selling on Rallies
  Major Currency Pair Scores: USD/CHF Signals Strong Bullish Momentum as NZD/USD Turns Heavily Bearish
  Bitcoin Consolidates Near $78K: Will Strong ETF Inflows Trigger a Breakout to $90K?
  FxWirePro: GBP/AUD struggle to extend its recovery, good to sell on rally


 - EconoTimes)


 Add as a preferred source on Google
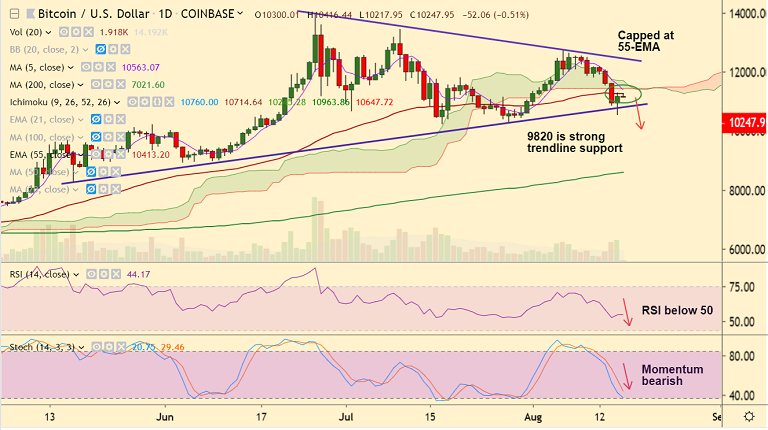
BTC/USD chart - Trading View
Exchange - Coinbase
Support: 9702 (100-DMA); Resistance: 10408 (55-EMA)
Technical Analysis: Bias Bearish
BTC/USD recovery from 2-week lows has paused at 55-EMA which is offering stiff resistance.
Technical indicators are still bearish for the pair, scope for resumption of weakness.
RSI is below 50 mark and Stochs are still biased lower. Bearish MACD crossover on signal line and ADX support weakness.
Price action is below cloud and bearish 5-DMA crossover on 20-DMA adds to the bearish bias.
We see scope for retest of trendline support at 9820. Breach below will see further downside.
On the flipside, breakout above 55-EMA will see test of 21-EMA (10795). Breakout above will see further upside.







