


 Crypto Major Pair Action Bias: ETHUSD Bullish as BTCUSD, SOLUSD & XRPUSD Stay Neutral
  FxWirePro- Major Crypto levels and bias summary
  ETH Stands Alone Bullish; BTC, SOL, XRP, BNB Neutral
  FxWirePro: GBP/NZD gains some upside momentum but still bearish
  FxWirePro- Woodies pivot (Major)
  FxWirePro: AUD/USD remains buoyant, looks to extend gains
  FxWirePro: USD/JPY uptrend loses steam, remains on bullish path
  AUDJPY Extremely Bullish Above 113: Strong AUD Fuels Fresh Rally – Buy Dips at 113 Targeting 115


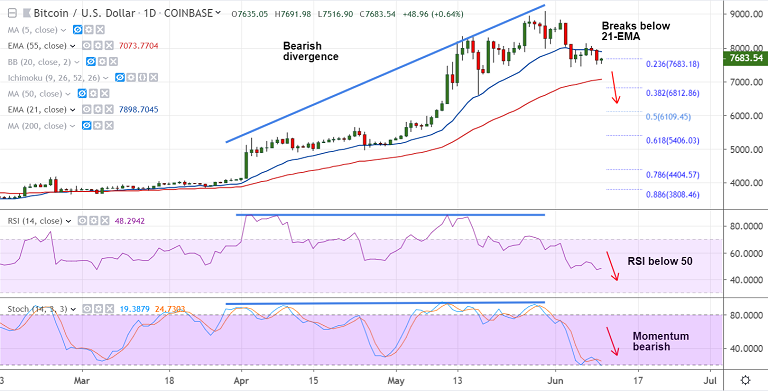
BTC/USD chart - Trading View
Exchange - Coinbase
Support: 7073 (55-EMA); Resistance: 8159 (20-DMA)
Technical Analysis: Bias Bearish
BTC/USD recovery from 3-week lows at 7427 lacks traction.
The pair is struggling to break above 21-EMA resistance, bias has turned bearish.
Price action has slipped below 4H 200-SMA and volatility is rising on the daily charts.
RSI has slipped below 50 mark on the daily charts and Stochs show bearish momentum.
Stochastics RSI on the weekly charts is at overbought levels. Stochs and RSI on the weekly charts are at overbought levels and on verge of a bearish rollover.
'Bearish Divergence' on RSI and Stochs on the daily charts keeps scope for weakness.
Scope for test of 55-EMA at 8159. Violation there will see next support at 38.2% Fib at 6812.
For details on FxWirePro's Currency Strength Index, visit http://www.fxwirepro.com/currencyindex.


