


 Crypto Action Bias: ETHUSD Stands Out as the Bullish Pair to Watch
  FxWirePro- Woodies pivot (Major)
  FxWirePro- Major Crypto levels and bias summary
  FxWirePro- Major Crypto levels and bias summary
  FxWirePro: GBP/USD rises as soft US data pressures dollar
  NZDJPY Bullish Rebound: Buy Dips as EMAs Align for 97 Target
  JPY Currency Meter Signals: NZDJPY Bullish (+25) vs CHFJPY (-100) – These Pairs Could Move Next
  FxWirePro:USD/JPY climbs back above 160.00 after BOJ rate decision
  FxWirePro: GBP/AUD bears maintain upper hand
  FxWirePro: USD/ZAR gains as stronger dollar outweighs upbeat South Africa's trade surplus
  NZDJPY Retreats on Yen Strength – Bearish Setup Targets 90 After Hitting 92.75 Low


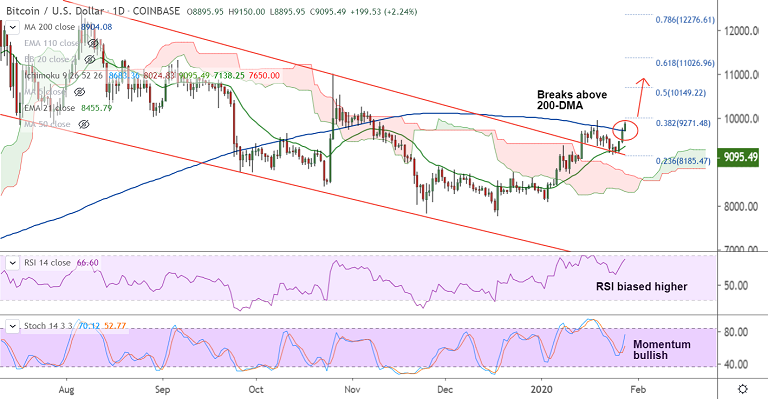
BTC/USD chart - Trading View
Exchange - Coinbase
Technical Analysis: Bias Bullish
Overbought/ Oversold Index: Neutral
Volatility: Rising
Support: 8904 (200-DMA); Resistance: 8904 (200-DMA)
BTC/USD has broken major resistance at 200-DMA at 8904, bias is strongly bullish.
The pair was trading 2.45% higher at 9113 at around 04:10 GMT, after closing 3.50% higher in the previous session.
Technical indicators are biased higher. MACD is on verge of bullish crossover on signal line. Positive DMI dominance and rising ADX support uptrend.
The hourly charts have confirmed a 'Golden Cross' formation (bullish 50-DMA crossover on 200-DMA) adding upside support.
Major and minor trend are bullish as evidenced by the GMMA and rising volatility with oscillators at neutral can see further gains.
Immediate hurdle lies at 38.2% Fib at 9271 ahead of upper Bollinger band (weekly) at 9905. Gains upto 10K likely.
Failure to hold above 200-DMA will see dip till 21-EMA (8456). Breach at 21-EMA support to see near-term weakness.







