


 FxWirePro- Major Crypto levels and bias summary
  FxWirePro: GBP/AUD drifts lower after BOE rate decision
  Nikkei Surges Past 65,000 on Suspected Yen Weakness: Tech Giants Like Advantest and NEC Lead Explosive Gains
  NZDJPY Bullish Rebound: Buy Dips as EMAs Align for 97 Target
  US Magnificent 7 Stocks Trend Score: Amazon & Microsoft Hit Extreme Bullish (+100) as Meta Drops to -100 — Key Resistance & Support Watchlist
  AUD/JPY Slips Below 112 as BOJ Intervention Sparks Bearish Momentum: Sell the Rallies
  US Magnificent 7 Stocks Trend Score: Amazon & Microsoft Hit Extreme Bullish (+100) as Meta Drops to -100 — Key Resistance & Support Watchlist
  NZDJPY Retreats on Yen Strength – Bearish Setup Targets 90 After Hitting 92.75 Low
  FxWirePro- Woodies pivot (Major)
  Crypto Pair Action Bias: ETHUSD Stands Out as the Bullish Pair to Watch
  FxWirePro:USD/JPY climbs back above 160.00 after BOJ rate decision
  Crypto Action Bias: ETHUSD Stands Out as the Bullish Pair to Watch


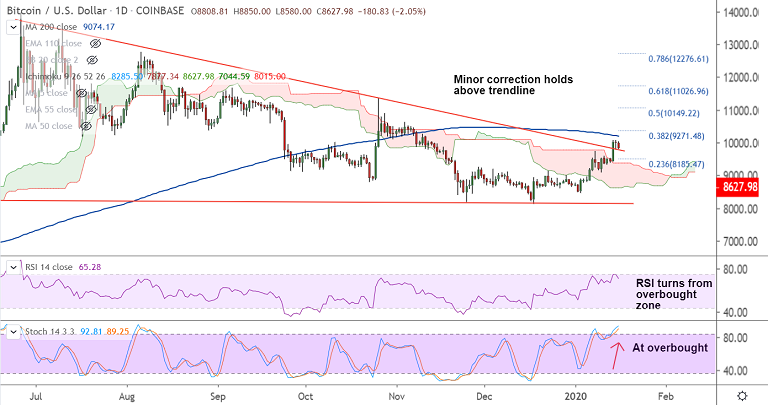
BTC/USD chart - Trading View
Exchange - Coinbase
Technical Analysis: Bias Bullish
GMMA Indicator: Major Trend - Turning slightly bullish; Minor Trend - Bullish
Overbought/ Oversold Index: Overbought
Volatility: High
Support: 8508 (5-DMA); Resistance: 9074 (200-DMA)
BTC/USD is showing a minor correction as oscillators correct from overbought levels.
The pair was trading 2.00% lower at 8633 at around 03:45 GMT, after closing largely muted with a dragonfly Doji formation in the previous session.
Technical studies are strongly bullish. Correction may not be deep as the pair finds strong support at 8200-8000 zone.
Price action has broken above 20W MA and break above 200-DMA (9074) will see bullish continuation.
200-DMA breakout raises scope for test of 11026 (61.8% Fib). Breach below 8000 could change near-term dynamics.


