


 In a rebuke to Trump, the Supreme Court rules that birthright citizenship is the law of the land
  JPMorgan Cuts Gold Price Forecast, Sees Bullion Reaching $4,500 by End of 2026
  Bank of America Upgrades T-Mobile to Buy, Says LEO Satellite Fears Are Overdone
  Trump has made more than $1 billion from crypto in a year. How?
  Goldman Sachs Says China Competition Weighs More on EU Growth Than Trade Deficit
  Citi Raises TSMC Price Target as AI Chip Demand Strengthens Growth Outlook
  Gold Surges Past $4150 on Dovish Fed Signals and Weak Jobs Data; Bullish Outlook Prevails
  Alcohol is one of the most dangerous drugs, yet its presence is ubiquitous in social settings and celebrations
  Bernstein Names IAG, Ryanair as Top European Airline Stocks Ahead of Earnings
  Vietnam’s population hit the 100 million milestone. Where’s it headed?
  Smartphones are helping filmmakers tell the stories the movie industry overlooks


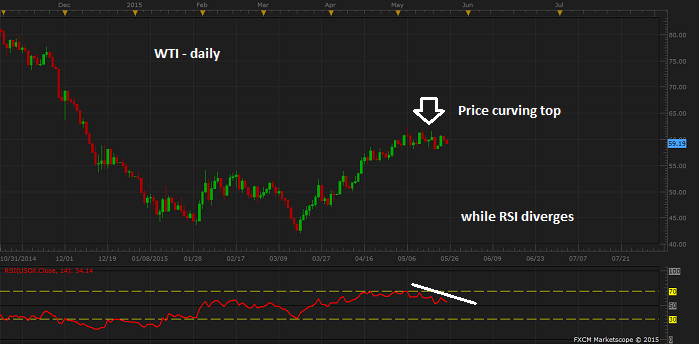
Price pattern is indicating that crude might be ripe to resume its down trend once again or at least go down and test lower support areas to find conviction among bulls.
- Since March this year WTI crude has given correction to its long down trend that has been active since June last year and pushed prices to $42/barrel from $106/barrel. Correction has pushed prices from $42/barrel in March to $62/barrel by early May.
- Series of bearish doji, both in daily and weekly chart posing doubts on bulls' ability to push forward. Now Crude price is curving a top in daily chart with RSI indicating that bulls' might be losing strength.
Even if Crude has to move higher and March's $42/barrel to remain intact, a correction seems to be on the radar and might generate profits in the short ter.
Probable trade -
- Sell WTI at current price with $63 as stop and $51-$52 area as initial target. WTI is currently trading at $59.2/barrel.
This trade makes fundamental sense too.
- Physical market stands well supplied with at least 2 million barrel/day of excess crude.
- Dollar seems to be done with its correction and moving higher.







