


 Alcohol is one of the most dangerous drugs, yet its presence is ubiquitous in social settings and celebrations
  USA at 250: the Black American struggle for life, liberty and the pursuit of happiness
  Gold Pulls Back After Hitting $4,180 as Geopolitical Risk Sends Crude Higher
  Smartphones are helping filmmakers tell the stories the movie industry overlooks
  Goldman Sachs Says China Competition Weighs More on EU Growth Than Trade Deficit
  Citi Raises TSMC Price Target as AI Chip Demand Strengthens Growth Outlook
  JPMorgan Cuts Gold Price Forecast, Sees Bullion Reaching $4,500 by End of 2026
  State of emergency in Crimea as Ukraine focuses pressure on ‘jewel in Putin’s crown’
  Bank of America Upgrades T-Mobile to Buy, Says LEO Satellite Fears Are Overdone


 - EconoTimes)


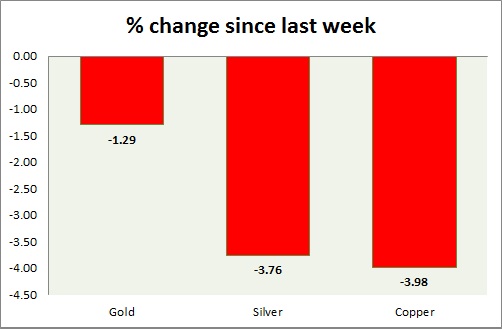
Metals are worst performer this week among asset class. Performance this week at a glance in chart & table -
Gold -
- Gold has fallen lower after bulls were halted at $1204 level, moved towards $1185 low so far.
- Price might move towards $1152 and $1133 level should price remain capped within $1224.
- Gold is currently trading at $1189, down -1.06% today so far. Immediate support lies at $1178, $1160 and resistance at $1224 and $1236-1240 area.
Silver -
- Silver is the worst performer today, as price traded as low as $15.59. Price is very close to support might get a bounce back from it. However trend remains downwards as price targets close to $14 and $12 as next.
- Mint ratio is up 0.22%, currently at 75.2. Mint ratio and precious metal prices are inversely related more often than not.
- Silver is currently trading at $15.8/troy ounce, down -1.24% today. Support lies at $15.42, $14 & resistance at $16.3-$16.6, $17.5-17.7.
Copper -
- Copper continue to move lower towards target, however beware of volatility.
- Bears remain in control. Trade was suggested with stop of $2.85 and target of $2.52-$2.47
- Bearish inverted hammer and bearish doji remains in play in weekly chart.
- Copper is currently trading at $2.68/pound, down -0.37% today, immediate support lies at $2.59 & resistance at $2.85, 2.93, and 3.07.
|
Gold |
-1.29% |
|
Silver |
-3.76% |
|
Copper |
-3.98% |


