


 Smartphones are helping filmmakers tell the stories the movie industry overlooks
  Goldman AM Sees Strong Buyout Opportunities in Japan, South Korea and Australia
  In a rebuke to Trump, the Supreme Court rules that birthright citizenship is the law of the land
  Vietnam’s population hit the 100 million milestone. Where’s it headed?
  Goldman Sachs Says China Competition Weighs More on EU Growth Than Trade Deficit
  Gold Pulls Back After Hitting $4,180 as Geopolitical Risk Sends Crude Higher
  Trump has made more than $1 billion from crypto in a year. How?
  State of emergency in Crimea as Ukraine focuses pressure on ‘jewel in Putin’s crown’


 - EconoTimes)


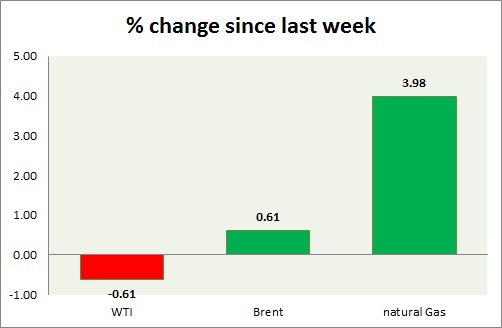
Energy segment is mixed gas advancing while oil lags. Weekly performance at a glance in chart & table.
Oil (WTI) -
- WTI dropped further today, as dollar gained back footing however gained back from $58.4 after dollar dropped post disappointing data.
- WTI carved bearish doji in weekly chart and very bearish grave stone doji in daily chart. Further downside remains open if doji high is not taken out. RSI is also around 50 level resistance.
- WTI is currently trading at $59/barrel. Immediate support lies at $55-54.6, $51.2-50 and resistance at $63-$65. $58 may continue to provide interim support.
Oil (Brent) -
- Brent is a better performer than WTI so far this week so far, however WTI is doing better today.
- Brent-WTI spread lost around 40 cents, currently trading at $6.8/barrel. Further rise seems likely in favor of Brent. Partial profit booking is suggested at this level.
- Brent is trading at $65.8/barrel. Immediate support lies at $63.7-63.2, 61.8-61.4 area and resistance at $ 70 region.
Natural Gas -
- Natural gas gained further ground after breaking $3 level. Further rise is likely, however price might go for consolidation around $3 before advancing further.
- Price target for bulls are coming close to $3.5/mmbtu, should support at $2.45 holds. Averaging it as low as possible would diminish risk.
- Natural Gas is currently trading at $2.98/mmbtu. Immediate support lies at $2.72, $2.65, $2.44 area & resistance at $3.06.
|
WTI |
-0.61% |
|
Brent |
+0.61% |
|
Natural Gas |
+3.98% |


