


 Best Gold Stocks to Buy Now: AABB, GOLD, GDX


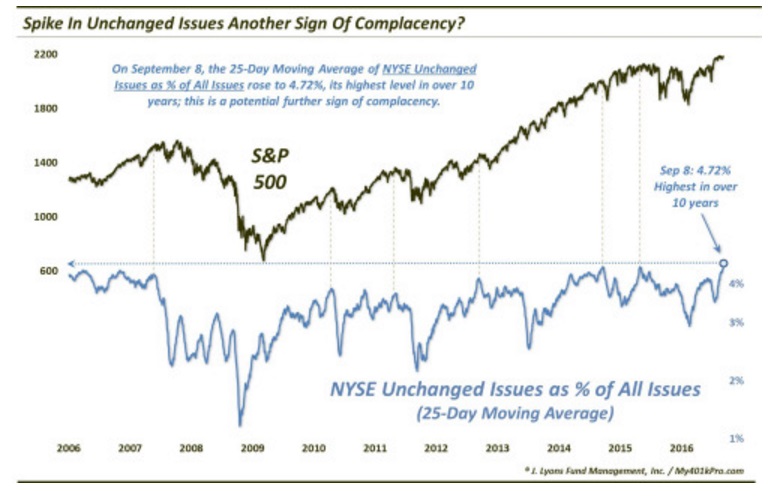
This contrarian complacency chart, which is shared by zerohedge.com, shows the 25-day moving average of the number of issues unchanged in a trading day as a percentage of all issues.
While a low number points to fear and could be seen as an indicator for a market bottom, highs are seen as a precursor to a top and points to the complacency in the market.


