


 Smartphones are helping filmmakers tell the stories the movie industry overlooks
  In a rebuke to Trump, the Supreme Court rules that birthright citizenship is the law of the land
  Trump has made more than $1 billion from crypto in a year. How?
  Vietnam’s population hit the 100 million milestone. Where’s it headed?
  Goldman Sachs Says China Competition Weighs More on EU Growth Than Trade Deficit
  Citi Raises TSMC Price Target as AI Chip Demand Strengthens Growth Outlook
  Gold Surges Past $4150 on Dovish Fed Signals and Weak Jobs Data; Bullish Outlook Prevails


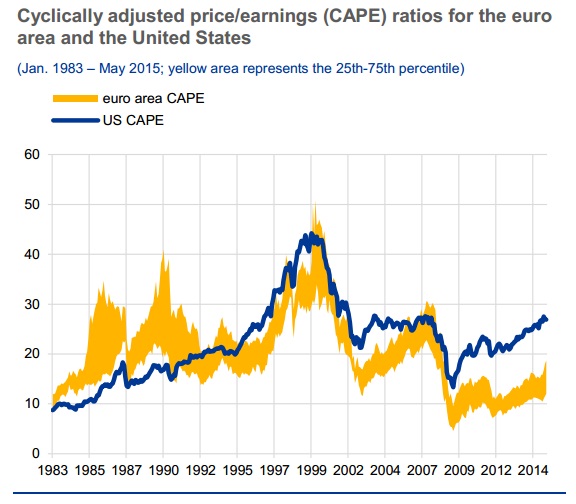
Fundamentally speaking US stock market seem somewhat stretched, as measured from CAPE ratio.
- Cyclically Adjusted Price to Earnings (CAPE) ratio was developed by is a valuation measure developed by Nobel Laureate Robert Shiller.
- It is defined as price divided by the average of ten years of earnings (Moving average), adjusted for inflation.
- It is principally used to assess likely future returns from equities over timescales of 10 to 20 years, with higher than average CAPE values implying lower than average long-term annual average returns. However fundamentalists have used this indicator to indicate extreme valuations. Historically speaking high CAPE ratio has been associated with burst in the stock market.
Current indication -
- Current analysis shows, that even at current price European stock market remain grossly undervalued compared to US markets.
- CAPE ratio, as shown in chart in US now stands in line with last seen during 2007/08 stock market boom and bust. Current CAPE ratio for S&P is hovering around 27. However that does not ensure that stocks are about to burst. During 2000 dot com bubble burst ratio reached 43 before stock market collapsed. However it is surely indicating that European markets have lots of juice left.
- Cape ratio for both Europe and US came in line in both of the last two burst (2001 &2008). So if history is any guide, European stocks will perform better compared to US over the coming quarters.







