


 Goldman Sachs Flags 3 Key Risks Ahead of Europe’s Earnings Season
  Gold Pulls Back After Hitting $4,180 as Geopolitical Risk Sends Crude Higher
  Bank of America Upgrades T-Mobile to Buy, Says LEO Satellite Fears Are Overdone
  Goldman AM Sees Strong Buyout Opportunities in Japan, South Korea and Australia
  Trump has made more than $1 billion from crypto in a year. How?
  State of emergency in Crimea as Ukraine focuses pressure on ‘jewel in Putin’s crown’
  JPMorgan Cuts Gold Price Forecast, Sees Bullion Reaching $4,500 by End of 2026
  Vietnam’s population hit the 100 million milestone. Where’s it headed?
  Alcohol is one of the most dangerous drugs, yet its presence is ubiquitous in social settings and celebrations
  In a rebuke to Trump, the Supreme Court rules that birthright citizenship is the law of the land
  USA at 250: the Black American struggle for life, liberty and the pursuit of happiness


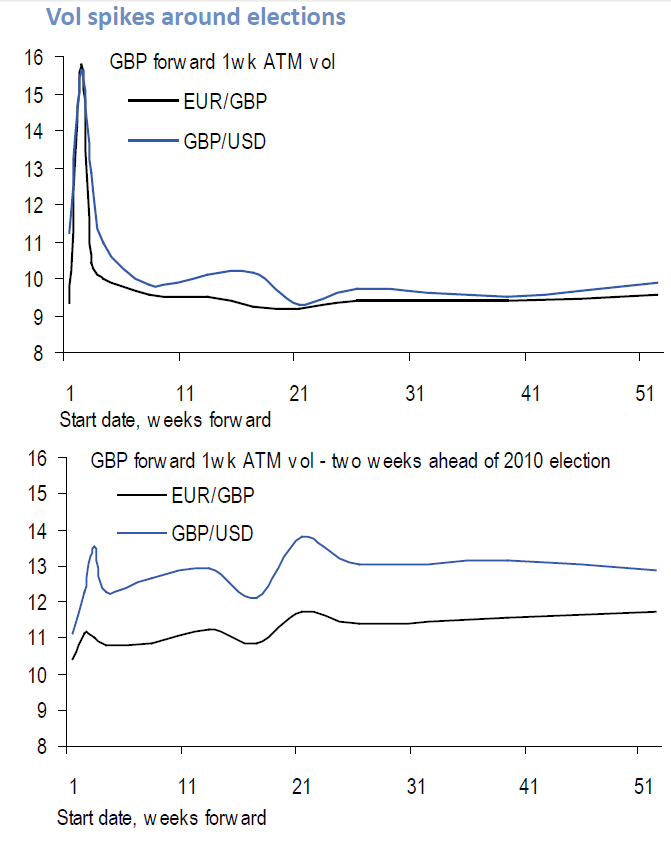
Experts might have thought the UK polls hazard now seems totally priced in and $, € and ¥ flying on feathers to do their natural business. But sterling may have something unusual as UK's election. This unpredictable political instability can be swept aside because the UK is currently in good shape of economy and enjoying stable, consumption-led growth that is not driven by debt.
Here we can take you through a bird eye view on sterling's sentiments on currency options & forwards.The election premium is even clearer if we look at volume in forward rather than spot terms, as plotted in volume diagram: In both €/£ and £/$, one week volume, two weeks forward (i.e., covering the immediate wake of the election) spikes as high as 16%. Compared to previous elections, the "election premium" in the volume curve is huge.
The second panel in diagram shows the same forward volume calculations ahead of the 2010 election. Again, there is a clear spike in volume for options that covered the immediate wake of the election, but compared to the 4-5 volume premium currently, the ~1 volume premium was small.
Aside from the size of the premium at its peak, the other notable feature of the volume curve in is how rapidly volume decays after the election. One week volume three weeks forward drops back to just 10% in EUR/GBP, and the picture in GBP/USD is similar.
Trade Ideas:
Overview: Slightly bullish
If a trader thinks above fundamental news impact positively on sterling, international traders can rationally accumulate long positions in forwards in order to hedge with below instruments according to their suitable forex exposures. Below are forwards shown only up to 3 months.
|
Instruments |
Bid |
Ask |
Net chg. |
Chg. % |
High |
Low |
|
EUR/USD 01M Forward |
3.84 |
3.91 |
0.005 |
0.12% |
16.56 |
3.77 |
|
EUR/USD 02W Forward |
1.57 |
1.68 |
0.03 |
1.85% |
1.75 |
1.62 |
|
EUR/USD 03W Forward |
2.53 |
2.65 |
0.02 |
0.77% |
2.635 |
2.575 |
Technical Watch:
|
Indicators |
RSI (14) |
STOCHASTICS (13 3 3) |
MACD |
CCI (14) |
|
Commentary |
68.6556 |
81.1457 |
0.0043 |
135.9665 |
We infer that the above oscillating indicators Stochastic and MACD suggest overbought scene though but there isn't enough confirmation of bearish sign where relative strength index and commodity channel line states bullish view. RSI & CCI are in convergence with price curve which is still a slightly upward signal. We could also see every bullish engulfing candles are appearing now & then on four hourly chart.







