


 FxWirePro :USD/JPY bulls loosen their grip a bit, dips to be bought
  FxWirePro- Woodies pivot (Major)
  GBPJPY Bullish on Consolidation: Holds Above 216 After 218 Top – Buy Dips at 217 Targeting 220
  FxWirePro: USD/CAD falls after BoC rate hold and weak U.S. producer inflation
  Major JPY Action Bias — Extremely Bullish Setups in NZD/JPY, AUD/JPY and CAD/JPY
  FxWirePro: EUR/AUD outlook weaker on renewed downside pressure
  FxWirePro- Major Crypto levels and bias summary
  FxWirePro: GBP/NZD downtrend slows, but bearish sentiment remains
  EUR/USD Holds Bullish Tone Despite Pullback from Yesterday’s High
  FxWirePro:EUR/NZD extends fall, key support lies ahead


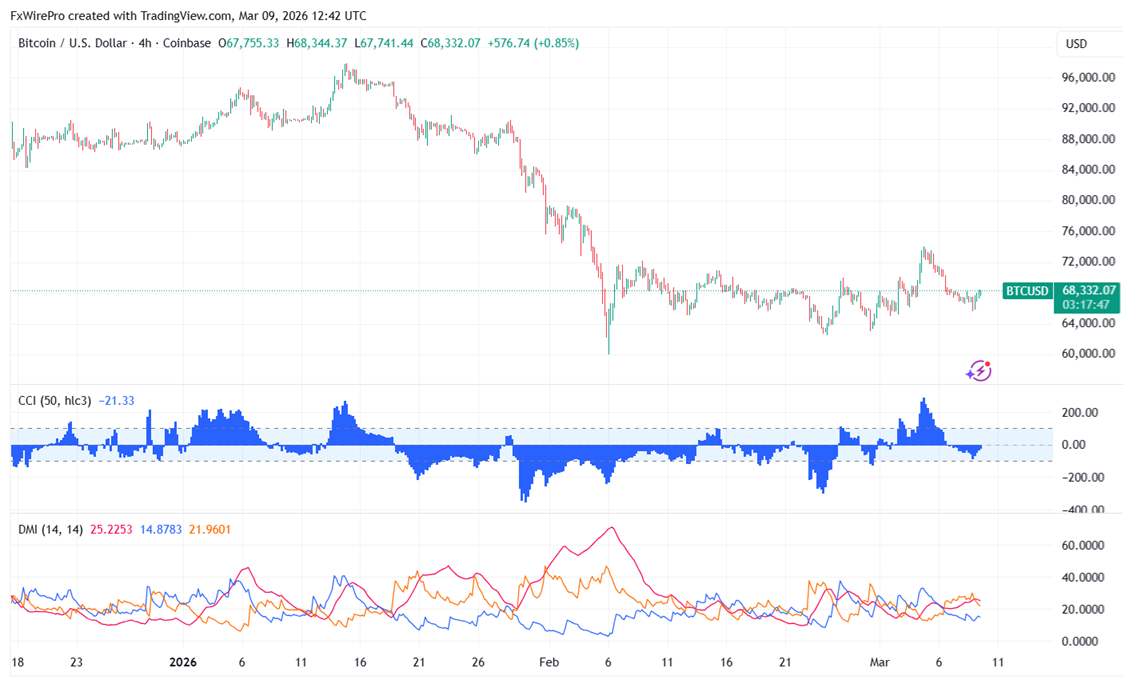
As crude oil prices rose, BTCUSD faded its radiance. It is presently trading around $68236 and has reached a low of $65618.
|
Technicals |
CMP -$68187 |
Trend |
|
|
4- Hour chart |
Value |
|
|
|
55 EMA |
$68217 |
CMP > 55 EMA |
Bullish |
|
200- EMA |
$70596 |
CMP <200- EMA |
Bearish |
|
365- EMA |
$75296 |
CMP < 365 EMA |
Bearish |
Major support- $64000/$60000/$52500/$50000. Minor bullishness only above $72500.
|
Momentum indicator (4-hour chart) |
Inference |
Value |
|
CCI(50) |
Bullish |
97.60 |
|
ADX |
Bullish |
Strength increased from 14.59 to 16.25 |
It is good to buy on dips around $67000 with SL around $64000 for a TP of $80000.


