


 FxWirePro- Major Crypto levels and bias summary
  FxWirePro- Major Crypto levels and bias summary
  JPY Major Currency Score: All Pairs Extremely Bearish
  FxWirePro: GBP/USD edges lower amid geopolitical tensions and inflation fears
  GBP/JPY Under Pressure: Rally Below 209.60 Offers Short Opportunity
  Market Outlook: Crypto Score Signals Extremely Bullish Structure Across BTC, ETH, SOL, and BNB
  FxWirePro: EUR/AUD downside pressure builds, key support level in focus
  FxWirePro: USD/JPY hits seven-month low, scope for further downside
  FxWirePro- Major Pair levels and bias summary
  FxWirePro: AUD/USD trades flat as market assess weak consumer sentiment data
  Major Pair Currency Score: USDCAD Extremely Bearish, USDCHF and AUDUSD Bullish
  FxWirePro: USD/ZAR edges higher as rand weakens ahead of key economic releases this week
  FxWirePro: EUR/NZD gains some ground, but outlook is bearish


 Add as a preferred source on Google
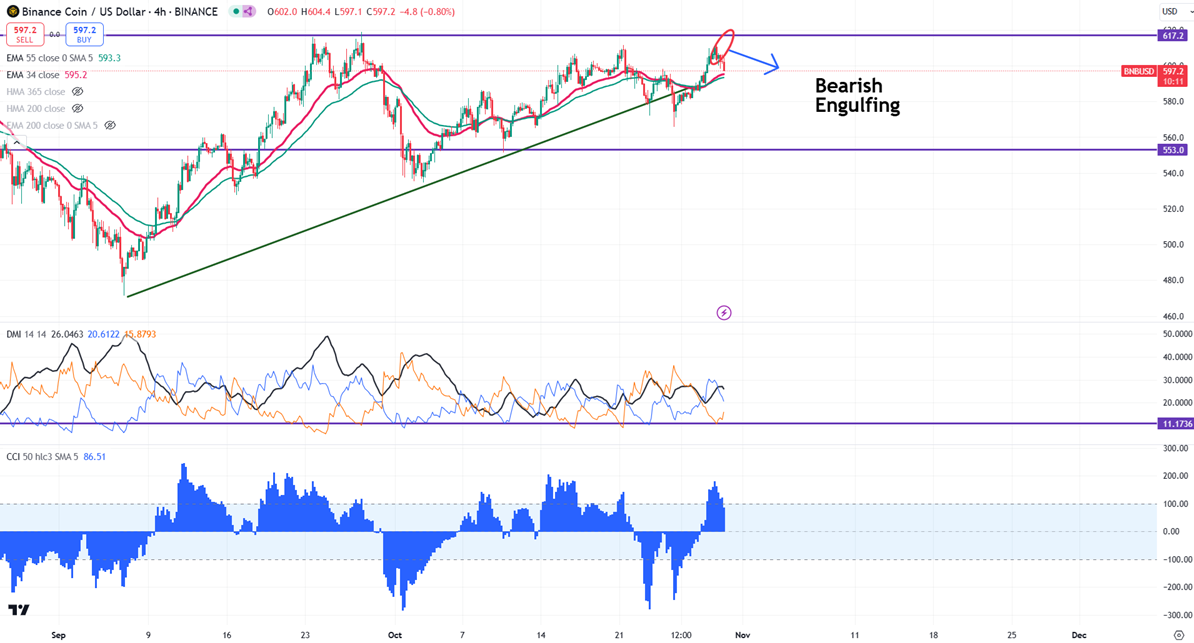
Key Level to Monitor: $550
Candlestick Pattern: Bearish Engulfing Pattern
The BNB/USD pair has formed a double top around 615andisexperiencingaminorsell−off.Aclosingpriceabove615andisexperiencingaminorsell−off.Aclosingpriceabove615 would signal that the upward trend may continue.
Currently, BNB/USD has declined by more than 10% due to profit booking, with the momentum now bearish, despite prices staying above the 34 and 55 EMA on the 4-hour chart. If the pair closes below $585, it could confirm a bearish trend for the day, potentially leading to further declines towards $565, $550, $540, $528, $500, and possibly down to $470.
Immediate Resistance is at $615. A successful breakout above this resistance could suggest bullish momentum, with further gains possible towards $647 or even $700, should it surpass $725.
Indicators (4-Hour Chart)
- Directional Movement Index: Neutral
- CCI (50): Bullish
Trading Strategy
Consider selling on rallies around 605-606, with a stop-loss set at \620 and a target price of $560.







