


 FxWirePro: NZD/USD steadies around 0.5830,retains bid tone
  FxWirePro:EUR/NZD extends fall, key support lies ahead
  FxWirePro: AUD/USD remains buoyant, looks to extend gains
  FxWirePro: USD/CAD falls after BoC rate hold and weak U.S. producer inflation
  FxWirePro: GBP/USD advance after softer US inflation dims Fed rate hike bets
  FxWirePro: GBP/AUD loses momentum but outlook is bullish


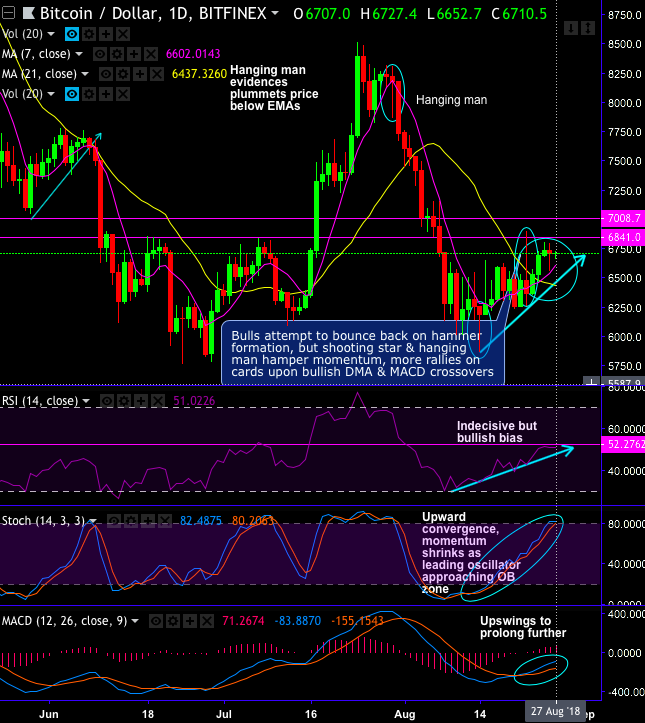
Today, although BTCUSD prices have attempted to bounce back from the lows of $6,652.7 levels to the current $6,722 levels, sharp shooting star and hanging man patterns have occurred previous weeks at $6,363.80 and $6,707 levels that signal bearish sentiment on the news of US SEC’s rejection of series of ETF proposals from three different companies. The previous bullish momentum also seems to be shrinking away.
As a result, the trend, so far, has gone sideways for the day with some minor bullish sentiments.
Last year, the journey from $735.3 to a whopping $19,891. (at BITFINEX exchange), or 2,605% surge was commendable. However, on the contrary, the Bitcoin bears have held steady from the last couple of months’ trading sessions.
It has tested the strong support at 78.6% fibonacci levels from the peaks of last december’2017, i.e. 5701 levels (refer weekly plotting).
As you could observe, both momentum and trend indicators seem to be indecisive but slightly in bullish favor.
While moving averages are highly effective tool for stalking the trend direction and strength of ongoing trend by capturing specific price data points over a specified period of time (as defined by the timeframe you are looking at) to constantly update the average price as it moves along the chart.
The position of the moving averages depends upon the nature of the asset you are looking at.
Usually, when prices are below a particular moving average, it signals to traders that the price has lost momentum and the trend has turned bearish (meaning price and sentiment are trending down).
On the flip side, if prices spikes above a moving average it can mostly be contemplated as bullish, as long as prices remain on top and coupled with backing from other indicators such as the Stochastic Oscillator or Relative Strength Index to append to your layers of confirmation.
The outline to moving averages and expedition to empathise the basic concepts begins with the simple moving average, which is computed by taking the mean of a given set of values and plotting it on the chart.
For instance, let’s ponder over a simple 7-day moving average, the closing price of each day is considered, add these values then divide by the number of days, in this case, 7. DMA & MACD bullish crossovers to discover just how much they can improve your bullish trading strategies.
Currency Strength Index: FxWirePro's hourly BTC spot index is at 117 (bullish), while hourly USD spot index is at -7 (which is neutral), while articulating at 06:37 GMT.
For more details on the index, please refer below weblink:


