


 Sell the Bounce: NZDJPY Bearish Bias Persists Below 94.20, Eyes 90.50
  FxWirePro: GBP/AUD runs out of steam but maintains bullish outlook
  FxWirePro: AUD/USD climbs as US-Iran peace deal sparks risk rally
  Ethereum Cracks Under $1,700: Sell the Rally Near $1,750 as Bears Eye $1,380–$1,200
  FxWirePro: GBP/NZD stuck in range but outlook is bullish
  BTC’s Bear Bounce: Sell the Rally Near $66K as Bears Target $59K–$52K Breakdown
  FxWirePro: USD/ CNY falls towards 6.750, bears keep the advantage
  Relief Rally Extends to 112.75, but AUDJPY EMA Structure Favors Selling
  FxWirePro: GBP/USD range-bound as Iran uncertainty keeps traders cautious
  FxWirePro: USD/ZAR edges higher, set to stay on back foot


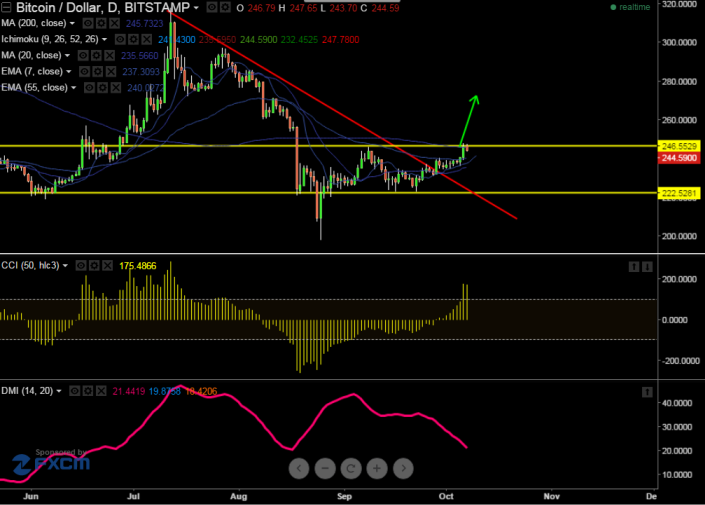
BTC/USD has broken major resistance $245 (200 day 4 HMA) and this confirms short term bullishness, a jump till $258/$272 is possible It is currently trading at $244.91. Short term trend is bullish as long as support $235 holds.
- The major resistance is around $245 and break above will take the pair to next target $258/$272.
- The pair's minor support is around $235 and any break below will drag the pair further down till $228/$220.
- Bullish invalidation only below $220
Indicator (Daily chart)
CCI (50) -Buy
Ichimoku- Buy
We prefer to buy around $240-242 with SL around $234.50 for the TP of $258/$272.


