


 BTC’s Bear Bounce: Sell the Rally Near $66K as Bears Target $59K–$52K Breakdown
  FxWirePro- Major Crypto levels and bias summary
  FxWirePro- Major Crypto levels and bias summary
  Ethereum Cracks Under $1,700: Sell the Rally Near $1,750 as Bears Eye $1,380–$1,200


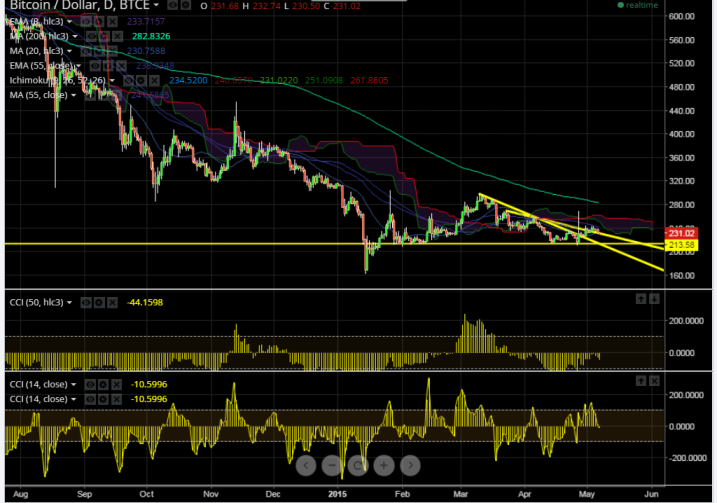
- BTC/USD is trading well above both short term resistance $237 (trend line joining $269.90 and $258.80) and also long term resistance $225 (trend line joining $299 and $257.48) and this confirms short term bullishness, a jump till $258 cannot be ruled out.
- The pair's major resistance is around $244
- On the down side short term weakness only below $224 and any break below will take the pair further down till $211.
Indicator (Daily chart)
CCI (50) - Sell
Woodies CCI (14) - Buy
Ichimoku- Buy
Strategy: Stand Aside


