


 FxWirePro: GBP/NZD slips as Middle East tensions fuel risk aversion
  FxWirePro: GBP/USD weighed down by renewed Middle East attacks
  FxWirePro- Major Crypto levels and bias summary
  FxWirePro: EUR/AUD edges higher but outlook still bearish
  USD/CHF Surges on Broad Dollar Buying, Eyes 0.8200 Next
  FxWirePro- Major Crypto levels and bias summary
  ETHUSD Bullish Momentum: Follows BTC Above All EMAs, Buy Dips Near $1750 Targeting $2300
  FxWirePro: GBP/AUD caught in narrow range, bias neutral
  FxWirePro- Major Pair levels and bias summary


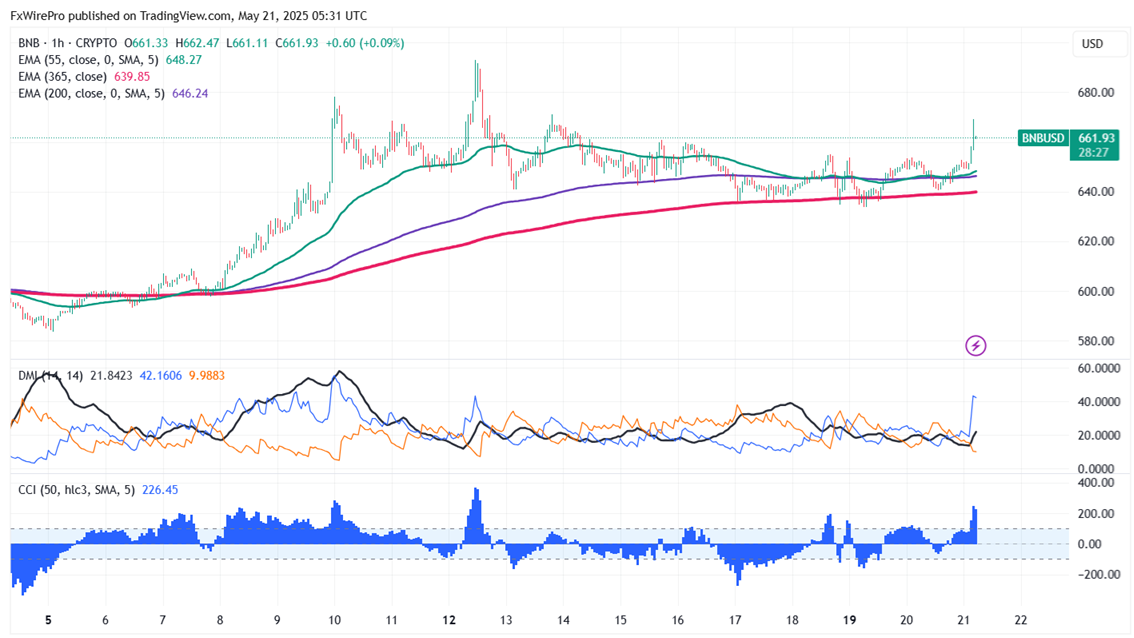
BNB/USD gained slightly following the foot steps of Bitcoin. It hits an high of $669 at the time of writing and is currently trading around $661.16.
Overall bias remains bullish as long as support $500 holds. It trades above the 55 ,200 EMA on the 4-hour chart. The pair took support near 34- 4H EMA and showed a minor pullback.Near-term support is around $640 , any breach below targets $600/$570/$520. If the pair closes below $500, potentially leading to further declines towards $400.
Immediate Resistance is at $680. A successful breakout above this resistance could suggest bullish momentum, with further gains possible towards $700/$730/$800/$1000.
Indicators (1-Hour Chart)
- Directional Movement Index: Bullish
- CCI (50): Bullish
Trading Strategy
It is good to buy on dips around $640 with a stop-loss set at $570 and a target price of $800/$1000.


