


 FxWirePro- Major Pair levels and bias summary
  NZDJPY Smashes 4-Month High on Kiwi Buying Frenzy – Bullish Setup Remains Strong
  FxWirePro- Major Crypto levels and bias summary
  FxWirePro: GBP/USD weighed down by renewed Middle East attacks
  BTCUSD Bullish Breakout: Clears 800-EMA After Consolidation, Buy Dips Toward $74,900
  GBPJPY Bullish Bias Stays Strong: Buy the 217 Dip, Target 220


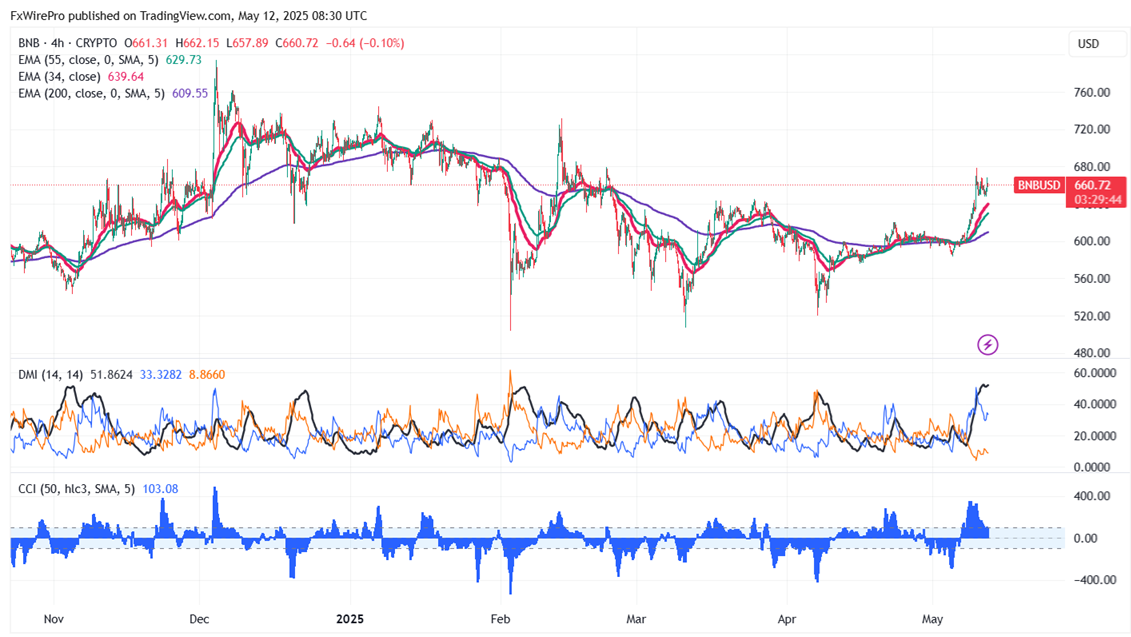
BNB/USD gained sharply following the foot steps of BTC. It hits an high of $678.20 yesterday and is currently trading around $661.08.
Overall bias remains bullish as long as support $500 holds. It trades above the 34 and 55 EMA on the 4-hour chart. Near-term support is around $640 , any breach below targets $600/$570/$520. If the pair closes below $500, potentially leading to further declines towards $400.
Immediate Resistance is at $680. A successful breakout above this resistance could suggest bullish momentum, with further gains possible towards $700/$730/$800/$1000.
Indicators (4-Hour Chart)
- Directional Movement Index: Bullish
- CCI (50): Bullish
Trading Strategy
It is good to buy on dips around $640 with a stop-loss set at $570 and a target price of $800/$1000.


