Home / Technicals / Article Technicals
Add as a preferred source on Google FxWirePro: Bearish RSI divergence on copper charts, good to go short on rallies Copper is extending downside from 6-month highs of 0.752 hit on Nov 27. We have noticed a bearish RSI divergence on daily charts. MACD line has also shown a bearish crossover on signal line. Support levels - 2.636 (1H 20…
By FxWirePro Team Dec 9, 2016, 9:33 AM UTC
Image from the original EconoTimes article Read the original article
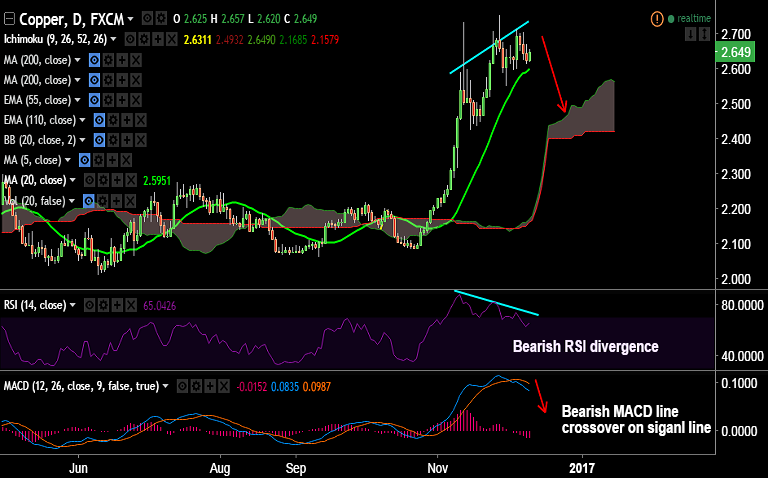
Copper is extending downside from 6-month highs of 0.752 hit on Nov 27.
We have noticed a bearish RSI divergence on daily charts.
MACD line has also shown a bearish crossover on signal line.
Support levels - 2.636 (1H 20-SMA), 2.595 (20-DMA), 2.550 (Nov 30 low)
Resistance levels - 2.655 (5-DMA), 2.670 (Dec 8 high), 2.706 (Dec 7 high)
Recommendation: Good to sell rallies around 2.650, SL: 2.70, TP: 2.620/ 2.595/ 2.550
Technicals EURUSD - Levels to watch - 1.1100 GBPUSD Levels to watch - 1.3180 USDCHF Levels to watch - 0.8365 USDCAD - Levels to watch - 1.4300 AUDUSD - Levels to watch - 0.7000 NZDUSD - Levels to watch - 0.5560
By FxWirePro Team Oct 15, 2026, 3:20 AM UTC
Technicals EURUSD - Levels to watch - 1.100 GBPUSD Levels to watch - 1.3180 USDCHF Levels to watch - 0.8400 USDCAD - Levels to watch - 1.4300 AUDUSD - Levels to watch - 0.7000 NZDUSD - Levels to watch - 0.5560
By FxWirePro Team Oct 15, 2026, 3:17 AM UTC
Technicals JPY Major Pair Currency Score: USDJPY, GBPJPY and AUDJPY Extremely Bearish
By FxWirePro Team Oct 15, 2026, 2:34 AM UTC